Sustainability Appraisal Scoping Report
(1) Chapter 4 Social Baseline
Population
4.1 Ipswich Borough has a total population of 137,349 people as of 2017 (made up of a roughly equal number of men and women). The largest age group in Ipswich is the 25-29 year olds (10,226). In addition, 20.3% or one in five residents are aged 15 or under.
4.2 Ipswich also has a high population of people of working age (64%) and relatively low numbers of retired people (16% of the Ipswich population). In contrast as can be seen from the graph below, the largest age group living in Suffolk Coastal, Mid Suffolk and Babergh are in the nearing retirement age group of 60-64.
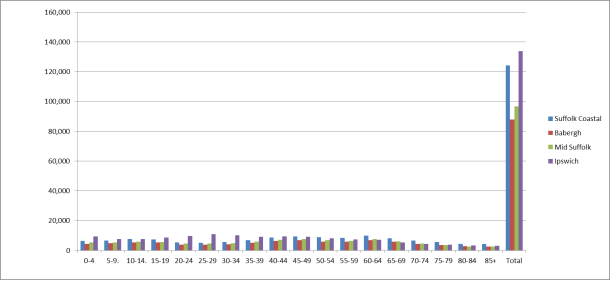
Figure 4: Total population by age group
4.3 Ipswich as an entirely urban area, is different in character from the surrounding districts which all have a large rural population as demonstrated in table 3 overleaf. Suffolk Coastal has the lowest number of people living in the country but Babergh, Mid Suffolk and Suffolk Coastal districts all have a much higher proportion of rural dwellers than the average for England and Wales.
|
Location |
% of population living within a rural setting |
|
Suffolk Coastal |
45 |
|
Babergh |
69 |
|
Mid Suffolk |
75 |
|
Ipswich |
0 |
|
Suffolk |
40 |
|
England and Wales |
20 |
Table 3: Percentage of the population living in a rural setting (Hidden Needs in Suffolk. 2016)
Population Projections
4.4 Table 4 below shows population projections across the IHMA from 2014 to 2024. It brings together different population components, these being natural change (the relationship between births and deaths), international migration (people moving to the IHMA from abroad), and UK migration (people moving into the IHMA from other parts of the UK).
4.5 As would be expected Ipswich is a much younger district than the rural districts, because of the availability of employment and further and higher education opportunities and this is demonstrated by the Natural Change figures. This means Ipswich expects to see more births than deaths across the decade, 2014-2024. Whereas the other regions are expected to experience more deaths than births, the largest negative figure being for Suffolk Coastal (-3.7%).
4.6 Net International Change and Net Within UK Migration represent migration in and out of the IHMA. It is clear from the table that the international migration is not going to have a major impact on the growing population of the IHMA in the near future. However, domestic migration will have a more significant impact.
|
LPA |
Population change (%) |
Natural change (%) |
Net international migration (%) |
Net within UK migration (%) |
|
Suffolk Coastal |
2.6 |
-3.7 |
-1.0 |
7.4 |
|
Babergh |
3.9 |
-2.4 |
-0.5 |
6.8 |
|
Mid Suffolk |
6.6 |
-0.5 |
-0.1 |
7.2 |
|
Ipswich |
5.0 |
5.6 |
-1.7 |
1.1 |
|
East of England |
8.9 |
3.2 |
2.5 |
3.1 |
|
England |
7.5 |
3.9 |
3.7 |
-0.1 |
Table 4: Population projections 2014-2024 [6]
Poverty and Social Exclusion - Teenage pregnancy rates
4.7 More than one in four teenage pregnancies was in Ipswich (26.9 of the total number of teenage pregnancies in Suffolk).This is level of teenage pregnancy is higher than you would expect in Suffolk and in comparisons with the rest of England, as illustrated in Figure 5 below. The number of teenage pregnancies in Ipswich did significantly decrease between 2012 and 2014 but still remains much higher than average when compared to the rest of Suffolk or England.
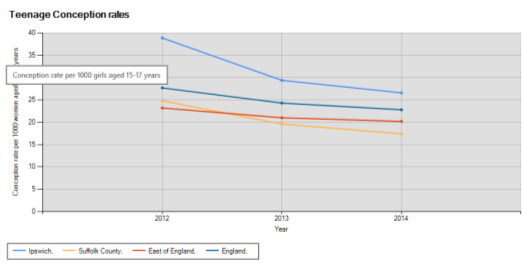
Figure 5: Ipswich Teenage Conception Rates (Suffolk Observatory)
Multiple Deprivation levels
4.8 There are a number of indicators that are used to look at the overall community wellbeing of a place and whether local residents are deprived in any way in relation to things like earnings, employment levels, health and disability, skill levels, living environment and other such measures. This is known as the 'Index of Multiple Deprivation Score' (IMD). There are 12 small areas in Ipswich within the most deprived 10% of communities in England.[7]
4.9 Figure 6 overleaf shows the IMD score for the IHMA authorities 2007-2015. There has been an increase in deprivation across the whole IHMA. Despite this increase the score for Suffolk Coastal remains below the average score for County as a whole and significantly below the score for Ipswich.
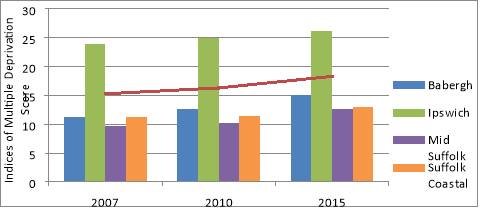
Figure 6: Index of Multiple Deprivation[8]
4.10 The Index of Multiple Deprivation ranks Lower Layer Super Output Areas to determine where the most and least deprived areas are in England. The map in figure 7 shows that Ipswich has a higher concentration of deprived Lower Super Output Areas than other authorities in the IHMA.
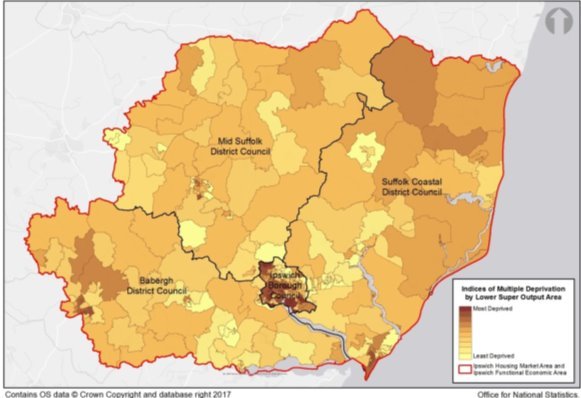
Figure 7: Indices of Multiple Deprivation by LSOA[9]
4.11 The 2015 Indices of Multiple Deprivation are the latest statistics available and they show that 12 of Ipswich's 84 Lower Super Output Areas (LSOAs) are within the 10% most deprived in England whereas just 2 are in the 10% least deprived.
Income Deprivation
4.12 Table 5 displays the figures for income-deprived children in the districts that make up the IHMA. Suffolk is home to almost 20,000 children living in income deprivation. 21.5% of children in Ipswich live in income deprived households that means one in five children in Ipswich live in poverty. This figure is much higher than the Suffolk County average. The table below shows that children's life chances are significantly affected by where they live.
|
|
Total number of children (0-15 years) |
Number of children in income deprivation |
% of children in income deprived households |
|
Suffolk Coastal |
21,565 |
2,234 |
10.5 |
|
Babergh |
15,772 |
1,953 |
12.5 |
|
Mid Suffolk |
17,689 |
1,732 |
9.9 |
|
Ipswich |
26,465 |
5,795 |
21.5 |
|
Suffolk |
133,408 |
19,979 |
15 |
Table 5: Income-deprived children[10]
4.13 Approximately 18,000 under 16s in Suffolk live in poverty, 13% of all children[11]. Ipswich has the highest levels of child poverty in the county and is higher than the national average. The impact of deprivation is associated with an increased risk depression, poor health, domestic violence, unemployment, limited access to educational resourcing books and computers.
4.14 Both income and employment, affecting working age people and older people has wide variations across the IHMA. Ipswich has the highest percentage of the population in overall income deprivation as well as that which affects older people and working age adults – when compared to the IHMA districts, and the national and regional figures. Suffolk Coastal is amongst the lowest for deprivation among working age adults, just above the figure for Mid Suffolk.
|
|
Income deprivation, all people (%) |
Employment deprivation among working age adults (%) |
Income deprivation affecting older people (%) |
|
Suffolk Coastal |
8.5 |
7.9 |
9.9 |
|
Babergh |
9.5 |
8.1 |
10.6 |
|
Mid Suffolk |
9.9 |
7.5 |
14.2 |
|
Ipswich |
16.3 |
13 |
17.5 |
|
Suffolk |
11.4 |
9.8 |
12.4 |
|
East of England |
11.9 |
9.8 |
13.2 |
|
England |
14.6 |
11.9 |
16.2 |
Table 6: Income and employment deprivation among working age adults and older people (Hidden Needs in Suffolk, 2016)
Ethnicity
4.15 According to the 2001 Census, the proportion of Black, Asian and Minority Ethnic (BAME) (non-white) groups in the Ipswich HMA was 2.9%. This is lower than that recorded for the East region (4.9%) and the national average (9.1%). The 2011 Census suggests that the BAME population has increased to 5.2% of the total population in the Ipswich HMA which is still notably smaller than the regional and national figures (9.2% in the East region and 14.5% in England). In Babergh the BAME population constitutes 2.2% of the total population, 11.1% in Ipswich, 2.1% in Mid Suffolk, 3.5% in Suffolk Coastal.
4.16 The figures below present the ethnicity of the population in the Ipswich HMA in 2011. The 'Asian or Asian British' represents the largest BAME group in the Ipswich HMA area (comprising 2.1% of total population). It should be noted that the 'White' group in the Ipswich HMA includes: 'White Irish' (0.5%); 'White Gypsy and Traveller (0.1%); and 'White Other' (2.9%) as well as 'White British' (91.3%).
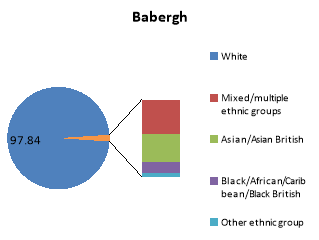
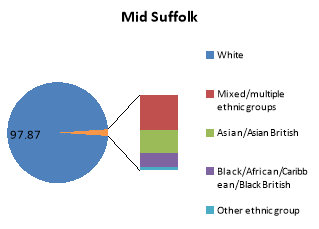
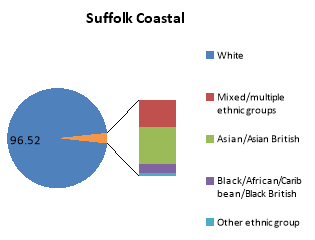
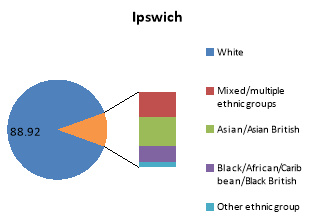
Figure 8: Ethnicity of the population in the IHMA by Local Authority[12]
Future Considerations
- Any change to migration trends
- Inequality
- Changing demographics especially in relation to a young population in Ipswich and planning for suitable services
Likely evolution of the Baseline without the Local Plan
- No opportunity to plan positively to reduce deprivation and improve social inclusion
- No opportunities to address ageing population and meet the needs of a changing population
Key data sources
- Nomis
- Hidden Needs in Suffolk
- ONS
- 2015 State of Suffolk Report
- Census
- Indices of Deprivation
- Ipswich & East Suffolk Clinical Commissioning Group Operational Plan 2017/18 – 2018/19
- Neighbourhood Statistics 2012
Key Issues for the Sustainability Appraisal
|
|
Key SA issue across Ipswich and Suffolk Coastal |
Ipswich Specific Issues |
|
Population |
The need to reduce inequality and social exclusion |
Ipswich scores worse than the Suffolk average against every indicator the 'Index of Multiple Deprivation Score' except, barriers to housing and services. One in five children in Ipswich lives in poverty. High comparative level of teenage pregnancy |
|
Impact of changing demographics and migration trends |
The Borough, compared to the rest of the county has a higher number of children, a higher population of working age because of the availability of job opportunities. Although there is an aging population, there is a trend to retire out to rural areas. Ipswich expects to see more births than deaths across the decade, 2014-2024. |
Table 7: Key Issues -Population
Housing
Housing Tenure
4.17 According to 2012 Census data, Ipswich records by far the lowest level of owner-occupiers with no mortgage (25.7%) but a relatively large social rented stock (21.6%) and a large private rented sector (19.9%). Mid Suffolk and Suffolk Coastal record the smallest social rented sector (11.2% and 11.4% respectively) and the greatest private rented sector (13.2% and 12.9% respectively). The tenure profile in Babergh is most similar to the regional average and can be considered as well balanced within this context.
4.18 Across all the districts in the Ipswich HMA there has been a fall in owner occupation with a mortgage between 2001 and 2011 and significant rises in the private rental sector, particularly in Ipswich, as illustrated in figure 9 below.
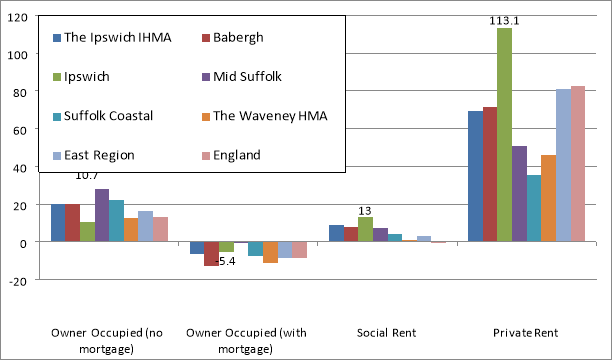
Figure 9: Change in number of households in each
tenure 2001-2011[13]
Housing Type
4.19 From the table overleaf it is apparent that there are clear differences in the housing type and number amongst the districts of the IHMA, particularly in Ipswich. Suffolk Coastal follows the characteristics of Babergh and Mid Suffolk. These districts contain large amounts of detached and semi-detached houses and fewer terraced houses and flats, when compared to Ipswich. This is no different from other rural and urban regions throughout the country.
4.20 The most common property type across the Ipswich HMA is detached houses followed by semi-detached dwellings. There are some notable differences within Ipswich; almost a quarter of dwellings in Ipswich are flats, whilst they make up no more than a tenth of the stock in the other three areas. Mid Suffolk contains the greatest proportion of detached houses whilst Ipswich has the largest percentage of terraced houses[14].
4.21 Since 2001 the number of flats has increased markedly in the Ipswich HMA, by 37.8%. Whilst this change is most pronounced in Ipswich a large growth in this property type is common to allauthorities within the Ipswich HMA. The change in the number of houses across the Ipswich HMA has been less notable, although terraced dwellings have recorded the biggest rise (11.9%), followed by detached properties (9.4%) and semi-detached homes (7.7%).
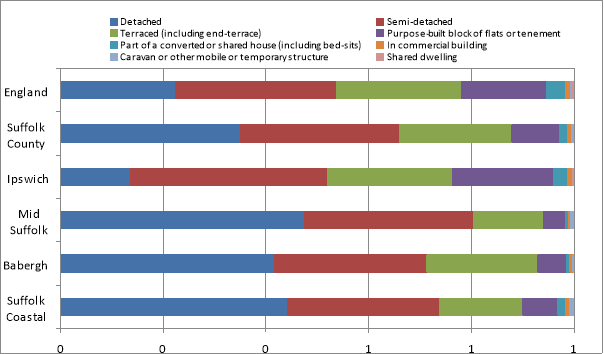
Figure 10: Dwelling Types in the Ipswich HMA, County and in England
Housing Completions
4.22 Table 8 overleaf shows the housing completions throughout the IHMA and the affordable housing completions as a proportion of overall completions for 2015. Suffolk Coastal has the highest proportion of affordable housing completions when compared to Babergh and Mid Suffolk. However, Ipswich has the highest percentage of affordable housing completions at 27% but this is much lower than the previous year's affordable housing proportion of total completions at 43%. Within the Ipswich HMA, Ipswich recorded the largest growth in dwellings (14.7%), followed by Mid Suffolk (14.0%), Suffolk Coastal (10.8%) and Babergh (8.2%).[15]
|
|
Net housing completions |
Affordable housing completions |
% affordable completions |
|
Suffolk Coastal |
564 |
101 |
18 |
|
Babergh |
157 |
31 |
20 |
|
Mid Suffolk |
304 |
78 |
26 |
|
Ipswich |
496 |
133 |
27 |
Table 8: Housing completions in 2015/16 (SCDC AMR 2016)
Dwelling Stock
4.23 The table below compares the size of accommodation (in terms of bedrooms) in both the Ipswich HMA and the Waveney HMA, the East region and England. The table indicates that there are a greater proportion of three bedroom properties and fewer smaller homes (two or fewer bedrooms) in the Ipswich Housing Area than the East region and England as a whole. Overall, three bedroom homes account for 43% of all dwellings in the Ipswich HMA. Mid Suffolk records the lowest proportion of small dwellings and the highest proportion of larger homes (four or more bedrooms). Ipswich has the largest proportion of small dwellings and the lowest level of large homes. Nearly half the properties in Ipswich are 3 bedroomed properties (49.9%) and just over a quarter of the properties in Ipswich are two bedroomed (25.4%).
|
Property Size |
The IHMA |
Babergh |
Ipswich |
Mid Suffolk |
Suffolk Coastal |
East |
England |
|
Bedsit |
0.2% |
0.1% |
0.3% |
0.1% |
0.2% |
0.2% |
0.2% |
|
1 bedroom |
8.5% |
6.3% |
12.8% |
6.0% |
7.3% |
10.4% |
11.8% |
|
2 bedrooms |
25.1% |
25.4% |
25.4% |
25.0% |
24.8% |
26.2% |
27.9% |
|
3 bedrooms |
43.4% |
42.0% |
49.9% |
40.4% |
39.8% |
41.4% |
41.2% |
|
4 bedrooms |
17.3% |
20.2% |
9.2% |
21.2% |
20.9% |
16.8% |
14.4% |
|
5 or more bedrooms |
5.5% |
6.0% |
2.5% |
7.2% |
7.1% |
5.1% |
4.6% |
|
Total |
100% |
100% |
100% |
100% |
100% |
100% |
100% |
Table 9: Size of dwelling stock (Census. 2011)[16]
Second Homes
4.24 Ipswich has a high number of cheaper ranged second homes than the other districts in the IHMA. Ipswich has the second highest number of second homes in bands A and B, and then drops to the lowest number of second homes across bands C to H. This is likely to be a function of letting properties to students and a buy-to-let market. Babergh and Mid Suffolk follow a more consistent pattern across all of the council tax bands.
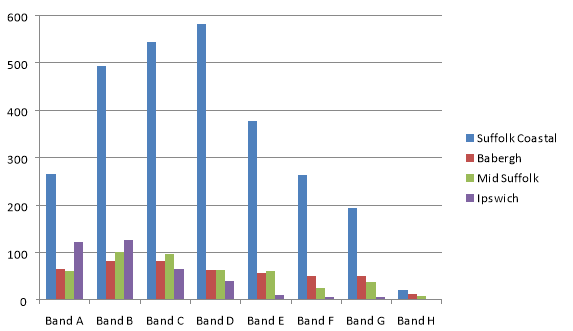
Figure 11: Second homes by council tax band in 2015 (Suffolk Observatory. 2015)[17]
Homelessness
4.25 In 2009-10 the rate of statutory homelessness[18] in Suffolk was 1 per 1,000 households or 300 households (see figure overleaf). Homelessness is an important public health problem; people in unsettled accommodation have higher health needs than their peers.
4.26 The figure below is useful in that it displays the rate of homelessness per 1,000 households across the IHMA. Ipswich has the largest number of homeless people overall. However, it also has the highest population of the four districts.
4.27 The rate of homelessness has decreased in Ipswich, Suffolk Coastal, and Mid Suffolk from 2004 to 2016 but has increased in Babergh.
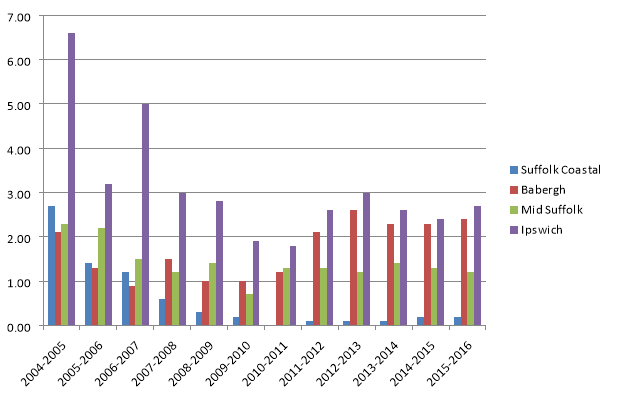
Figure 12: Rate of homelessness per 1,000 households (Suffolk Observatory. 2016)[19]
Housing Price to Income Ratio
4.28 Figure 13 overleaf shows the change in house price to income ratio, of the lower quartile, which gives an indication of the affordability of housing in relation to income. The graph shows that all districts have seen an increase in house price to income ratio from 2005 to 2007, which is then followed by a period of decline reaching its lowest point in 2011. The ratio then rises to 2015.
4.29 Ipswich in 2015 has the lowest house price to income ratio at 6.44 in the IHMA. This means that homes cost on average 6.44 times average income. However, for many people this is still out of reach, even though it is below the England average in 2015 (which is an improvement in the relationship than between 2008-2015 when the Ipswich ratio lies higher than the national average). This means that in Ipswich, housing is generally more affordable than in the other authority areas in the IHMA.
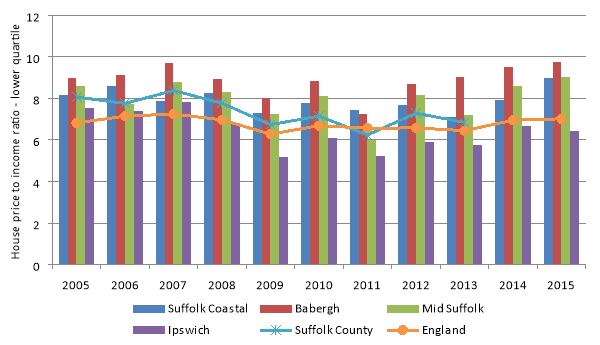
Figure 13: House price to income ratio – lower quartile (Suffolk Observatory. 2016)[20]
Average House Prices
4.30 The table below indicates that Suffolk Coastal recorded the highest average price per dwelling in 2016, followed by Babergh and Mid Suffolk. Prices in these three areas are considerably higher than those in Ipswich. In addition, the average prices in Suffolk Coastal are the only ones higher than the East Region.
4.31 The table also shows that average property prices have increased fastest in Babergh, then Ipswich, Mid Suffolk, and Suffolk Coastal. All of the districts of the IHMA experienced a greater percentage increase than the national average. However, these are all below the regional percentage change.
|
Location |
Median price Jul – Sep 2010 |
Median price Jul – Sep 2016 |
Median price Jul – Sep 2010 - 2016 |
|
Babergh |
£193,000 |
£250,000 |
29.5% |
|
Ipswich |
£128,000 |
£165,000 |
28.9% |
|
Mid Suffolk |
£180,000 |
£225,000 |
25.0% |
|
Suffolk Coastal |
£207,000 |
£254,000 |
23.2% |
|
East Region |
£189,000 |
£250,000 |
32.3% |
|
England |
£180,000 |
£220,000 |
22.2% |
Table 10: Median property prices, 2010 and 2016 (Land registry. 2016)[21]
4.32 Over the last two years house sales have fallen by 50% in Ipswich, as illustrated in figure 14 below.
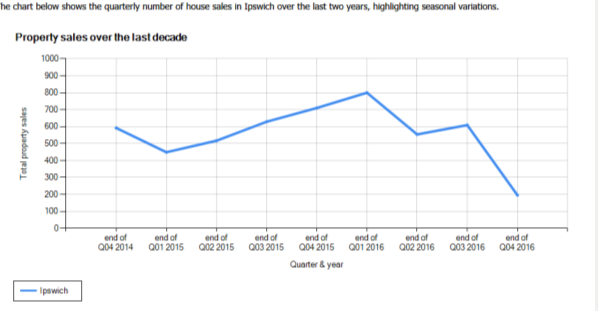
Figure 14: Property sales in Ipswich over the last decade (Suffolk Observatory Ipswich Profile)
Future Considerations
- Changing Housing Tenure Models
- Second Homes in lower Council Tax bands
- Land Availability
- Changing household composition as a result of changing demographics and housing needs e.g. requirement for more student accommodation when the University of Suffolk expands.
- Affordability
- Homelessness
- Ensuring that homes are of a good quality, in all tenure types
Likely Evolution of the Baseline without the Local Plan
- Not planning positively for an appropriate mix of housing types and tenures
- Lack of standards for new homes
- Not meeting the housing need (i.e. the Objectively Assessed Need)
- Not meeting the need for affordable homes without intervention
- Decline in delivery of homes
Key data sources
- Land Registry
- Joint Housing Strategic Housing Market Assessment (SHMA) – Peter Brett & Associates
- Suffolk Observatory
- Census
- Suffolk Coastal AMR
Key Issues for the Sustainability Appraisal
|
|
Key SA issue across Ipswich and Suffolk Coastal |
Ipswich Specific Issues |
|
Housing |
The need to ensure the delivery of a sustainable supply of housing |
Limited land availability and large areas of protected land. Over the last two years house sales have fallen by 50% in Ipswich. |
|
Ensuring the delivery of mix of housing types and tenures (including affordable housing) |
Low comparative level of owner occupiers with no mortgage, higher socially rented stock and higher private rental sector. Ipswich has the lowest house price to income ratio in the IHMA. Homes cost on average 6.44 times average income. However prices have risen significantly in the last few years and Ipswich has the highest affordable housing need. Need to deliver a more diverse range of housing types. The impact of a changing population on housing supply. Increased demand for specialist housing including student accommodation. |
Table 11: Key Issues – Housing
Health and Wellbeing
Health Perception
4.33 The 2011 Census shows more than three quarters of the population (81.4%) of the Borough's population considers themselves to be in "very good health" or "good health". This correlates with the very low number of people in Ipswich who describe themselves in poor or very poor health (4.3%) compared to 16.7% of residents in the East region and 17.6% of people across England.[22] This is probably explained by the high proportion of the population of Ipswich which is 25 or under (31.2%) which accounts for nearly one third of the population of the Borough.[23] This is broadly mirrored in Babergh, Mid-Suffolk and Suffolk Coastal Districts.
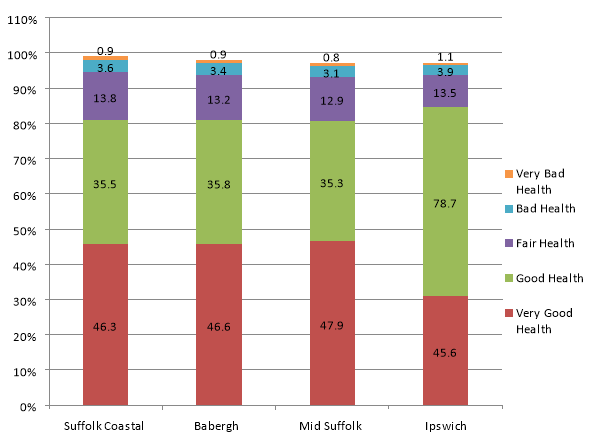 Figure 15: Health Perceptions in the IHMA
authority areas[24]
Figure 15: Health Perceptions in the IHMA
authority areas[24]
4.34 People over 65 accounted for 61% of all unplanned hospital admissions in Suffolk in 2009, and 60% of the total cost of hospital admissions in Ipswich and East Suffolk.[25]
Provision of health services
4.35 Ipswich & East Suffolk Clinical Commissioning Group (CCG) has set the following clinical priorities in their two-year operational plan[26];
- to improve care for frail elderly;
- to improve mental health outcomes;
- to improve cancer and end of life outcomes;
- to improve the health of people most in need;
- to ensure high quality local services;
- to improve the health and education of children and young people; and
- to promote self-care and prevention
4.36 The 2015/16 year end assurance assessment showed that the Ipswich & East Suffolk CCG was rated as 'requiring improvement'.[27]
There are 18 GP practices in Ipswich.[28] 9 GP practices in the CCG with a deprivation score above the England average deprivation score.
4.37 12.1% of the population (48,001) are in the most deprived 20% of people in England. There are around 24 care homes in Ipswich and 12 nursing homes and 35 dentists and dental services practices.[29]
4.38 In 2017/18-18/19, the CCG will spend over £960m on commissioning healthcare services for around 397,000 people who are registered with 40 GP practices. The 40 practices are divided into four localities;
- Suffolk Brett Stour;
- Commissioning Ideals Alliance;
- Deben Health
- Group; and
- Ipswich
4.39 The Ipswich and East Suffolk heath and care system has been working with organisations in West Suffolk and North East Essex, partners, patients and the public to develop a shared vision and ambitious local plans for accelerating delivery of the 'NHS Forward View' through production of a five year Sustainability and Transformation Plan ( STP). the CCG and its STP partners will change the shape of health and care services, shifting the centre of care away from hospitals into local communities as people are supported to take control of their own health and wellbeing.
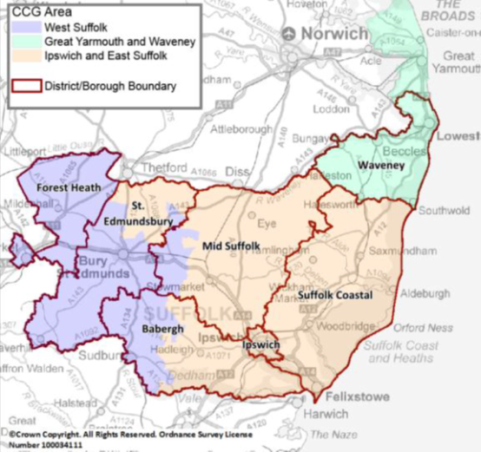
Figure 16: Source: Ipswich & East Suffolk Clinical Commissioning Group Operational Plan 2017/18 – 2018/19
Life Expectancy
4.40 The life expectancy at birth for Ipswich men is 78.9 years which is below the national average of 79.1 years. It is also lower than the other districts within the Ipswich Housing Market Area. These figures are : Babergh 81.4 years; Mid Suffolk 81.3 years; and Suffolk Coastal men is 80.8 years all of which are above the national average meaning men on average with the exception of Ipswich live longer on average than in the rest of England.
4.41 The figures for women are as expected slightly higher and there is less of a difference between Ipswich and the other districts within the Ipswich Housing Market area. Again however, in Ipswich female life expectancy is slightly lower at 83.2 years compared with 84 years in Suffolk Coastal, 84.3 years in Babergh, and 84.5 years in Mid Suffolk. All the districts forming the Ipswich Housing Market authorities have a higher life expectancy than the national average of 83 years in England. Therefore women have a higher life expectancy than men and in Ipswich. These figures are for men and women born between January 2009 and December 2013.
4.42 Figure 17 shows the average deaths as a proportion of the population between 2007 and 2012 for each of the authorities across the Ipswich Housing Market Area and the county of Suffolk. Suffolk Coastal and Babergh have the highest average deaths across the Housing Market Area. As can be seen from figure 17 below, the most populous age group in both Suffolk Coastal and Babergh is the 60-64 age group. However, the 25-29 age group is the most populous in Ipswich.
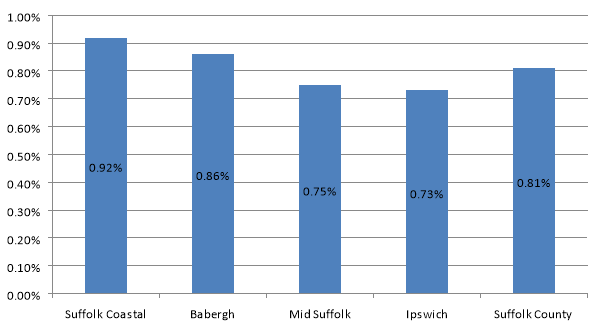
Figure 17: Average deaths as a proportion of the population, 2007-2012[30].
Obesity in Young Children
4.43 From table 12 overleaf it can be seen that the proportion of children measured to be at a healthy weight is very high, at an average of 73.2%. However, when the data is split into 'year 6' and 'reception' as seen in the table, there is a drop from 78% of children at 'reception' that are of a healthy weight to 69% of children in 'year 6' that are of a healthy weight.
4.44 Across the Ipswich Housing Market Area, Ipswich has the highest average percentage of children that are obese (14.3%) and underweight (0.9%).[31] The State of Children in Suffolk[32]report states that, "Suffolk's children have low rates of physical activity, high levels of sedentary behaviour, and low concordance with national guidelines for fruit and vegetable consumption, albeit similar to the pattern seen regionally and nationally."
|
|
Obese (%) |
Overweight (%) |
Healthy weight (%) |
Underweight (%) |
|
Year 6 |
|
|
|
|
|
Suffolk Coastal |
16.5 |
13.6 |
68.4 |
1.5 |
|
Babergh |
14.1 |
14 |
71.3 |
0.5 |
|
Mid Suffolk |
15.2 |
14.8 |
69 |
1 |
|
Ipswich |
18.7 |
13.2 |
67.2 |
0.9 |
|
East of England |
17.7 |
14.1 |
67.1 |
1.2 |
|
England |
19 |
14.4 |
65.3 |
1.3 |
|
|
|
|
|
|
|
Reception |
|
|
|
|
|
Suffolk Coastal |
8.8 |
14.3 |
76.7 |
0.2 |
|
Babergh |
7.7 |
14.1 |
77.9 |
0.4 |
|
Mid Suffolk |
7.7 |
13.2 |
78.7 |
0.3 |
|
Ipswich |
9.9 |
12.9 |
76.2 |
0.9 |
|
East of England |
9 |
13.1 |
77.1 |
0.8 |
|
England |
9.4 |
13.2 |
76.1 |
1 |
Table12: Obesity levels of children (Census. 2011)[33] – see chart above
Long term health issue or a disability
4.45 Figure 18 overleaf shows the number of residents with a long-term health problem or disability in 2011. From the current data Suffolk Coastal has the highest number of residents with long-term health problems that come under the 'day to day activities limited a little' section, which comes to 10.6% of the overall population. This figure is just below Ipswich for the number of residents with 'limited a lot' health problems, which stands at 8% of the overall population.
4.46 According to the Census, some 17.6% of the resident population in the Ipswich HMA have a long-term health problem or disability, compared to 16.7% of residents in the East region and 17.6% of people across England. Although Ipswich has the highest number of residents with long-term health problems or disabilities that 'limit day to day activities a little', as a percentage of the overall population (9.6%) it is the lowest figure. Therefore, it has the smallest percentage of the population that have long-term health problems that limit day to day activities a little when compared to the other authorities across the wider plan area.
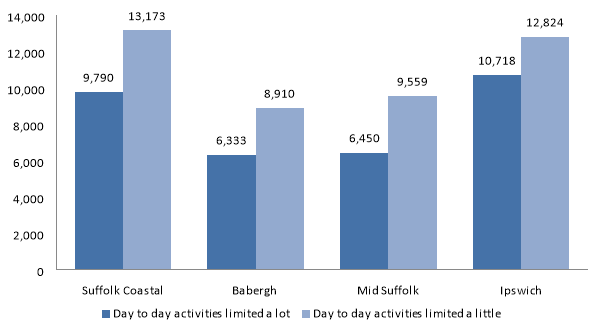 Figure 18: Day to day activities limited a lot
and a little[34]
Figure 18: Day to day activities limited a lot
and a little[34]
4.47 The Projecting Adult Needs and Service Information (PANSI) estimates show a clear relationship between physical disability and age, with the prevalence of moderate physical disability increasing by a factor of 4 between the ages of 18 and 64 and serious disability increasing by a factor of 7.[35]
Physical activity
4.48 Increasing physical activity and exercise is a key Government objective in order to improve physical and mental health. Mid Suffolk (29.6%) has the highest percentage of the population that completed three 30 minute sessions of physical exercise per week in 2014, followed by Suffolk Coastal (27.8%), Babergh (26.5%), and Ipswich with the lowest figure in the region (19.3%).
4.49 Figure 19 overleaf indicates the percentage of the population that have completed three 30 minute sessions of physical exercise per week from 2007 through to 2015 for each district. The graph usefully demonstrates the totals for each district across the years as well as the individual annual statistics. Ipswich maintains its position as having the lowest levels of physical exercise at every year measured. Babergh and Mid Suffolk, however, are consistently above the county averages for each year. So too is Suffolk Coastal with the exception of 2009-11.
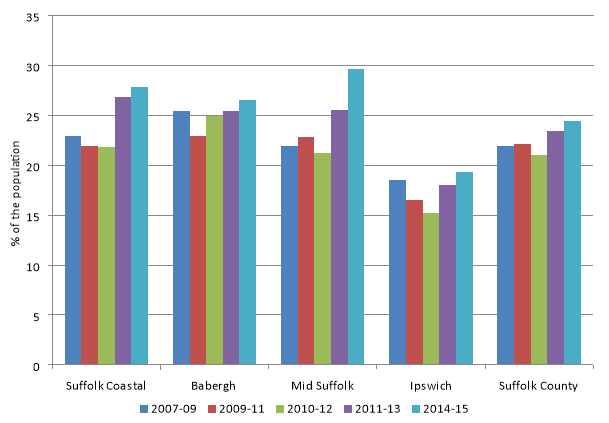 Figure 19: Percentage of the population
completing 3 x 30 minutes of physical exercise per week.
(Suffolk Observatory.
2015)14
Figure 19: Percentage of the population
completing 3 x 30 minutes of physical exercise per week.
(Suffolk Observatory.
2015)14
Mental Health
4.50 People with mental health disorders and disabilities have a higher risk of poor physical health and premature death than the general population. Reasons for this include the impact on physical health of deprivation and poverty, but also associated lifestyle behaviours with poor nutrition, obesity, higher levels of smoking, heavy alcohol use and lack of exercise. This contributes to higher rates of morbidity and lower life expectancy among people with mental health problems (Friedli and Dardis, 2002).
4.51 In Ipswich and east Suffolk it is estimated that there are approximately 45,766 people with common mental health disorders; 1,279 people with a borderline personality disorder; 998 people with antisocial personality disorder; 1,137 with psychotic disorders and 20,477 with psychiatric comorbidity [33].
Gypsy and Traveller Health
4.52 Gypsies and Travelers experience some of the worst health in all BME groups[36]. On average, Gypsy and Traveller infants are 2-3 times more likely to die than infants in the general population. Twice as many Gypsies and Travelers report anxiety or depression compared to the general population. Up to 16% are not registered with a GP, and immunisation rates are low. Barriers to healthcare access include low levels of literacy and fear of racism[37].
Recorded Crime
4.53 Both the National Planning Policy Framework (NPPF) and Planning Practice Guidance (PPG) set out guidance in creating safe and accessible communities. In particular, I would draw your attention to the following: paragraphs 58 and 69 of the NPPF recommend that local planning authorities ensure their policies and decisions aim to create safe and accessible environments where crime and disorder, and the fear of crime, do not undermine quality of life or community cohesion.
4.54 Paragraph 164 advises that when preparing their Local Plan, local authorities should work with local advisors and others to ensure that they have taken into account the most up-to-date information about higher risk sites in their area for malicious threats and natural hazards, including steps that can be taken to reduce vulnerability and increase resilience. The Design section of the PPG includes crime prevention and security measures.
4.55 Ipswich (7,265) had the highest number of criminal offences committed in 2013, amongst the local authorities across the Ipswich Housing Market Area, followed by Suffolk Coastal (3,111), Babergh (2,605), and Mid Suffolk (2,190).
4.56 When the total offences are compared to the populations for each authority, Ipswich still shows the highest figure with 5.45%, this is followed by Babergh 2.97% and Suffolk Coastal at 2.5%. The figures for Ipswich are also higher than the regional average and the England average, with all other authorities being below these regional and national figures.
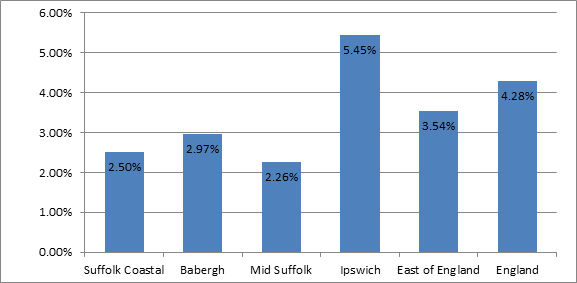
Figure 20: Total offences as a proportion of the population (NeSS, 2013)[38]
4.57 The Police and Crime Commissioner for Suffolk has a Police and Crime Plan for Suffolk 2017 -2021 which gives Suffolk Constabulary the clarity to deliver the Commissioner's objectives and priorities for Suffolk Constabulary. This is supported by an action plan and performance management framework.
Fear of crime
4.58 There is little data on fear of crime at a regional/local level. The Crime Survey[39] for England and Wales is undertaken annually and provides data for England and Wales overall. We will continue to discuss data with Norfolk and Suffolk Constabulary as we continue through the SA process.
Living environment
4.59 Noise, vibration and light pollution can all impact upon wellbeing. It is important to ensure that the ambiance of towns and villages supports the vitality of the community and to reduce nuisance from these forms of pollution.
Future Considerations
- Health and social care provision going forwards
- Changing lifestyles and the rise in lifestyle related illnesses
- Continuing health inequalities
Likely Evolution of the Baseline without the Local Plan
- The design of new development may not encourage people to walk and cycle to access work, facilities and services therefore not improving potential for healthier lifestyles.
- Not designing out the potential for crime in new development proposals may encourage living environments that have greater potential for crime and antisocial behaviour.
Key data sources
- Suffolk Observatory 2015
- Neighbourhood Statistics 2012
- Census 2011
- ONS
- SHMA update 2017
- NHS JSNA
- Department of Health and Public Health England.
- Healthy Suffolk Website
Key Issues for the Sustainability Appraisal
|
|
Key SA issue across Ipswich and Suffolk Coastal |
Ipswich Specific Issues |
|
Health and Wellbeing |
The need to ensure the delivery of health and social care provision in line with growth |
Population is younger than the county, regional and national averages. Requirement to retain and improve existing community health facilities and services and ensure the timely delivery of new facilities to meet needs arising from new development |
|
The need to address health inequalities and public health |
Gypsies and Travellers experience some of the worst health in all BME groups. Ipswich has proportionally more 0-5 year olds than other districts |
|
|
Promoting healthy lifestyles |
Ipswich has the lowest levels of physical activity in the region |
|
|
Crime rates and anti-social behaviour |
Ipswich had the highest number of criminal offences committed in 2013 in the IHMA. Addressing fear of crime. |
Table 13: Key issues – Health and Wellbeing
Education
Qualifications
4.60 Table 14 shows the qualification levels of each of the districts of the Ipswich Policy Area, ranging from 'no qualification' up to 'NVQ4 and above'.
4.61 More than one in five of the population in Ipswich has gained NVQ Level 4 although this is still the lowest number across the Ipswich Housing Market Area and in comparison with the East of England and Great Britain. At the other end of the scale, Ipswich also has the highest number of people with no qualifications although with the exception of Suffolk Coastal, Babergh and Mid Suffolk also have higher numbers of unqualified people than the regional average or expected in comparison with the rest of Britain. Overall in comparison with the rest of the region and Britain, Ipswich has lower levels of qualified people at all levels in 2015.
|
Individual Level |
Suffolk Coastal (%) |
Babergh (%) |
Mid Suffolk (%) |
Ipswich (%) |
East of England (%) |
Great Britain (%) |
|
NVQ4 and above |
36.7 |
23.4 |
29.4 |
22.5 |
33.6 |
37.1 |
|
NVQ3 and above |
55.5 |
41.3 |
51.1 |
41.4 |
52.0 |
55.8 |
|
NVQ2 and above |
72.4 |
68.8 |
70.0 |
63.0 |
71.5 |
73.6 |
|
NVQ1 and above |
87.3 |
81.8 |
83.3 |
81.8 |
84.9 |
84.9 |
|
Other qualifications |
8.7 |
8.9 |
# |
6.9 |
7.1 |
6.5 |
|
No qualifications |
# |
9.3 |
10.0 |
11.3 |
8.0 |
8.6 |
Table 14: Qualifications of the resident population Jan 2015 – Dec 2015 [40] (# means the sample size is too small for a reliable estimate to be made)
4.62 Figure 21 overleaf illustrates the trend in academic achievement over 12 years, from 2002-2014. From 2002 through to 2012 the general trend is upwards, with the authorities across the Ipswich Housing Market Area broadly reflective of the regional and national statistics.
4.63 However, as of 2013 there is a significant decline in GCSE attainment (which also reflects the national picture). The average figure for all of the authorities across the Ipswich Housing Market Area in 2013 was 71%, dropping to 63.7% in 2014. This is a very large fall in the number of pupils obtaining at least 5 A*-C GCSE grades. It can be explained by the Joint Council for Qualifications (JCQ) as a consequence of a large rise in the number of 15 year old pupils taking GCSEs compared to previous years (increasing 39% compared with 2012, to 806,141). JCQ also note other factors for drop in grades, such as; multiple entries in Maths GCSE, and harder science GCSE papers[41].
4.64 From the graph below, it is clear that most of the authorities of the Ipswich Housing Market Area, except Ipswich, sit above the regional and national figures in 2002. However, a significant rise in the regional and national attainment figures means that all the IHMA authorities now fall below the regional and national figures.
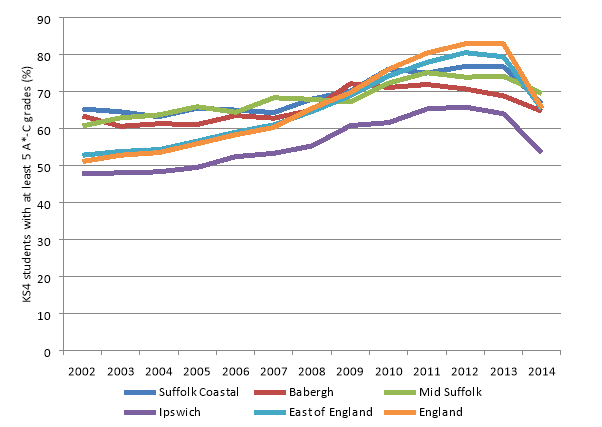 Figure 21: KS4 students receiving at least 5 A*-C
grades, 2002-2014 (NeSS. 2014)[42]
Figure 21: KS4 students receiving at least 5 A*-C
grades, 2002-2014 (NeSS. 2014)[42]
School Leavers
4.65 Around half of year 11 young people in Ipswich move into sixth form education with 49.9% of pupils in Ipswich. However, this is below the Suffolk average of 53.2%.
4.66 The proportion of year 13 school leavers, at the end of A-levels leaving to go to university and specialist colleges for the Arts such as Conservatoire for music, dance and art colleges for example, is lowest in Ipswich (43.1%), and highest in Mid Suffolk (58.7%).Ipswich has a lower than average number of students going to university than the Suffolk average.
4.67 Year 11 school leavers that are not in education or employment (NEET) is highest in Ipswich (3.5%) and is significantly above the county average. Ipswich also has the highest level of students entering further education in comparison to the other authority areas in the Ipswich Housing Market Area and this is also above the county average.
|
|
Suffolk Coastal (%) |
Babergh (%) |
Mid Suffolk (%) |
Ipswich (%) |
Suffolk County (%) |
|
Sixth Form |
62 |
57.9 |
55.4 |
49.9 |
53.2 |
|
Further Education |
28 |
33.6 |
34.2 |
37.5 |
36.6 |
|
NVQ2 Employment |
4.7 |
4.8 |
6.3 |
4.8 |
4.6 |
|
GST Trainees |
0.6 |
0.8 |
1.4 |
2.6 |
1.3 |
|
Non NVQ2 Employment |
0.6 |
0.9 |
0.3 |
0.7 |
0.7 |
|
NEET |
2.1 |
1.3 |
1.5 |
3.5 |
2.1 |
|
Unknown |
2.1 |
0.7 |
0.8 |
1.1 |
2.1 |
Table 15: Year 11 school leavers (Suffolk Observatory. 2014)[43]
|
|
Suffolk Coastal (%) |
Babergh (%) |
Mid Suffolk (%) |
Ipswich (%) |
Suffolk County (%) |
|
Higher Education |
53.1 |
51 |
58.7 |
43.1 |
49.7 |
|
Gap Year |
2.3 |
1.3 |
5.6 |
3.3 |
3.3 |
|
Sixth Form |
9.4 |
17.2 |
11.7 |
14.5 |
13.4 |
|
Further Education |
6.9 |
4.1 |
3.6 |
8.3 |
6.3 |
|
NVQ2 Employment |
7.1 |
6.7 |
9.7 |
11.2 |
8.3 |
|
GST Trainees |
0 |
0 |
0 |
0.2 |
0 |
|
Non NVQ2 Employment |
9.7 |
14 |
5.8 |
11.9 |
10.6 |
|
NEET |
4.4 |
2.5 |
1.8 |
4 |
3.5 |
|
Unknown |
7.2 |
3.2 |
3 |
3.5 |
4.9 |
Table 16: Year 13 school leavers (Suffolk Observatory. 2014)[44]
4.68 In key stage 2, primary schools in Ipswich achieved an average of 53% of pupils achieving level 4 or higher in maths and English. This is slightly lower than the England average of 58%.
Online Education
4.69 There is a growing market for online education services. This links into digital infrastructure and the need for better broadband across the IHMA, especially in the rural areas. The ability to achieve high academic attainment through online resources offers rural communities more options when considering schooling and also alleviates problems on schools that are experiencing pressures on capacity. There is also improving capacity delivering higher education on-line nationally that can be accessed anywhere in the UK.
Educational Facilities - Schools
4.70 The number of school aged children and young people is growing as the county sees spikes in localised population growth, net increases in immigration and a large amount of new developments for the revitalised housing market. Suffolk County Council is the Local Authority responsible for education provision. Any new school that opens in the county must be an academy, free school or voluntary aided school.
4.71 The main urban areas and market towns are expected to accommodate major growth in the form of urban extensions or new communities. These developments are usually on the periphery of towns and often some distance from existing schools and other community infrastructure.
4.72 Patterns of population change will also affect Suffolk's local communities. In some areas inward migration is a major factor, particularly where new development is planned. There is also inconsistency across the county in terms of future birth rates with some areas of the county seeing a decreasing population whilst other areas spike.
4.73 Suffolk County Council, in its Education and Learning Infrastructure Plan 2.1, produced in 2016 states that between 2015 and 2019 pupil forecasts show the total school population will increase by over 4,500 (5%) (primary age increasing to over 6%; secondary starting to increase in the next couple of years and continuing for at least the next 10 years). Within this growth there are particular growth 'hot spots' such as Ipswich.[45]
4.74 The maps overleaf in figures 22 and 23, show the 'hotspot' areas of the county. The shaded areas are identified as having the biggest need for additional places across the county based on natural population growth.
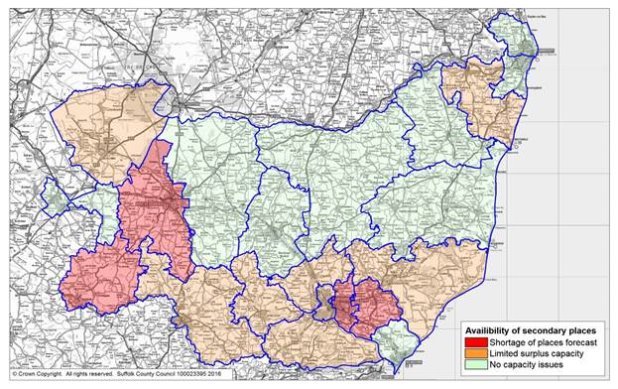
Figure 22: Availability of Secondary School Places,
2016[46]
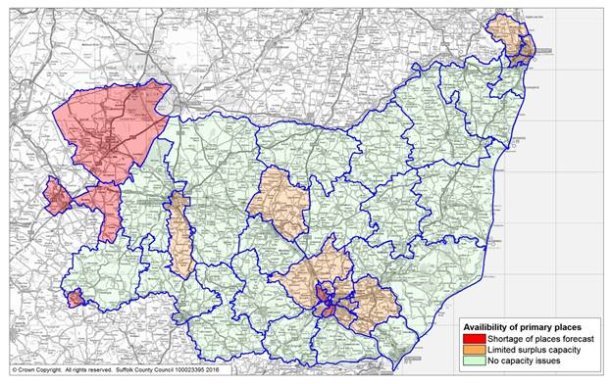
Figure 23: Availability of Primary School Places, 2016[47]
4.75 Ipswich is one of the identified hotspot areas of the county where growth in the number of school age children has seen a significant increase in demand for places across the town. In the last 3 to 4 years there have been 6 forms of entry (FE)* added to primary schools in Ipswich, which equates to around 1,260 additional school places as those forms of entry move up through those schools.
4.76 In terms of secondary provision, whilst the increase in primary numbers has yet to hit the secondary schools, Suffolk County Council expects the secondary schools to be nearing capacity in 2021/22. However, there have been hot spot areas across the town, particularly in the north east that have required some expansion. Northgate High School has recently taken an additional 1FE so that it is able to meet demand from its catchment area.
4.77 Whilst the expansions to primary schools have met demand in certain areas of the town there is still growth from inward migration and housing concentrated around the centre of the town and to this end a new school has been approved and is set to open in September 2019. The County Council, based on recent forecasting data, believe that a one form of entry school (210 places) is an adequate size to meet existing demand but that the school needs to be built to be able to expand to 420 places. This is in order to meet future demand based on the likelihood of the population growing again and to take into account those housing developments that are not approved and therefore do not feature in their data.
4.78 In terms of primary provision, there is also a potential expansion to Rose Hill Primary School (from 315 to 420 places) should developments in the area be approved. Suffolk County Council are also monitoring any potential growth at Ravenswood and in the area of Old Norwich Road.
4.79 Further primary school expansions, or even the planning for further new schools, will be dependent on further growth across the town.
4.80 For Secondary, to offset current demand in hotspot areas across the town, there are plans to expand two or maybe three high schools, but as yet these plans are not confirmed and may be dependent on developments being approved within, or on the outskirts of the town.
4.81 The proposed development at Ipswich Garden suburb of around 3,500 homes will potentially yield 860 primary age pupils. Suffolk County Council are planning for three 315 place primary schools, plus early years provision, which are able to be future-proofed to expand to 420 place if necessary should further growth arise in the area. The plan is that one primary school will be built in each of the three individual developer areas, Henley Gate, Fonnereau and Red House.
4.82 The development is also expected to yield approximately 610 secondary age pupils. There will also be the aforementioned issue of latent demand as the secondary schools in Ipswich reach capacity due to the recent primary bulge in demand working its way through to secondary provision. Therefore, to offset the demand from the development and the latent demand there is the need for a new high school that will also be built on the Ipswich Garden Suburb development. This school will likely be built to accommodate 900 pupils with the ability to expand further as demand grows and to offset the possibility of further development.
4.83 There is the possibility that one or more of these schools could be a Free School but this is dependent on the government's future strategy regarding Free Schools and Grammar Schools.
Educational Facilities – Early Years
4.84 Suffolk County Council is required to secure sufficient early learning places for eligible 2 year olds, estimated at 40% of the total 2 year old population, and all three and four year olds. An early learning place is defined as 15 hours per week for 38 weeks of the year and eligible children are entitled to take up the place in the term after their second birthday. This entitlement is aimed at our more disadvantaged families and impacts on the ability of the current market to deliver enough places in the localities where most needed.
4.85 In May 2015 it was announced that the government was doubling the provision of free childcare from 15 to 30 hours a week for three and four year-olds. The offer, being introduced in 2017, will be available to families where both parents are working or the sole parent is working in a lone parent family. This has huge infrastructure implications for Suffolk and work is underway to establish how this demand can be met.
Educational Facilities – Special Educational Needs
4.86 Suffolk is an inclusive authority with the majority of children and young people with a statement of special educational need placed in mainstream settings. However there has been a sharp increase in the demand for out of county placements for children and young people with an increased level of additional requirements. There are particular pressures across the county on the availability of Behavioural Emotional and Social Difficulties (BESD) and Autistic Spectrum Disorder (ASD) provision.
4.87 The collection of timely, robust and meaningful LA and partnership needs assessment data has proved difficult to access and as such the ability to predict the future needs of the children and young people across Suffolk has been problematical. However, there is work being currently undertaken to remedy this and provide Suffolk County Council and its partners with the ability to better quantify with greater certainty, the future demands for specialist places.
Future Considerations
- Meeting the shortage of education places in Ipswich
- The impact of changes to school funding on education provision in the county
- School capacity and building programmes
- The impact of academies and free schools on the provision of education in the IHMA
- Ensuring that children in the IHMA are getting a high quality education and raising standards of attainment
- Identifying which schools can be expanded in terms of infrastructure, such as hall space, playing fields or access
- Identifying the requirement for management and staffing for school expansion and/or new schools
Likely Evolution of the Baseline without the Local Plan
- Risk of not matching supply of education facilities to meet the demand from new housing growth.
- Ipswich will continue to have low levels of qualified people compared to the rest of the region and Britain.
- The risk that investment in education infrastructure does not take place at the appropriate time and in the most appropriate location leading to shortages of appropriate provision.
Key data sources
- Suffolk Observatory
- NOMIS
- NeSS
- Suffolk County Council
- Ipswich & East Suffolk Clinical Commissioning Group Operational Plan 2017/18 – 2018/19
Key Issues for the Sustainability Appraisal
|
|
Key SA issue across Ipswich and Suffolk Coastal |
Ipswich Specific Issues |
|
Education |
The need to ensure the delivery of education provision in line with growth |
Insufficient primary and secondary capacity in some areas of the Borough. |
|
The need to ensure appropriate skills to match future employment needs |
Overall in comparison with the rest of the region and Britain, Ipswich had lower levels of qualified people at all levels in 2015. |
Table 17: Key Issues - Education
[12] Data from the Ipswich and Waveney Strategic Market Housing Assessment, 2017
[14] (New 2017 Peter Brett Study)
[18] The definition consists of two elements: 1.Homelessness acceptances – Number of households who are eligible, unintentionally homeless and in priority need, for which the local authority accepts responsibility for securing accommodation under part VII of the Housing Act 1996 or part III of the Housing Act 1985; and 2. Households in temporary accommodation – Number of households in "temporary accommodation" as arranged by local housing authorities. It is not possible to calculate this rate currently.
[20] House price to income ratio - Suffolk Observatory
[22] SHMA update 2017 p 7
[23] QS103EW - Age by single year NOMIS 2011 Census
[24] Data from 2011 Census
[25] JSNA General overview 201/16 p.
[26] Ipswich & East Suffolk Clinical Commissioning Group Operational Plan 2017/18 – 2018/19
[27] https://www.nhs.uk/service-search/performance-indicators/organisations/gp-practices?ResultsViewId=1171&PageSize=10&MetricGroupId=463&SortingMetricId=-1&Latitude=52.056&Longitude=1.15&LocationName=Ipswich%2C%20Suffolk%2C%20IP1&LocationId=11412&CurrentPage=2&SortDirection=Ascending&InShortList=False&Radius=5&CurrentSearchType=Location
[28] Op cit
[29] Op Cit
[34] Census 2012
[35] Ipswich & East Suffolk CCG 2013/14
[45] The Suffolk County Council Education-and-Learning-Infrastructure-Plan(-Version-2.1) , page 7
[46] Suffolk County Council
[47] Suffolk County Council