Sustainability Appraisal Scoping Report
(1) Chapter 5 Environmental Baseline
Water
5.1 The main waterbodies in the IHMA are the rivers Gipping, Orwell, Deben, Alde and Ore. The IHMA falls within the Anglian River Basin District and the IHMA contains the Deben, Gipping and Suffolk Coastal catchment areas.
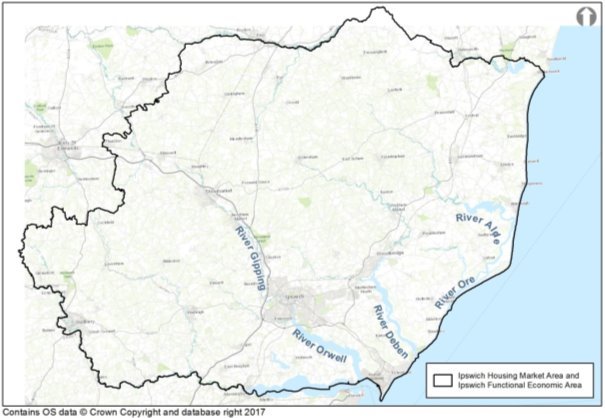
Figure 24: The Main Rivers in the IHMA[48]
5.2 There are multiple stakeholders involved in the management of water in the IHMA:
Anglian Water is the water company responsible for public sewerage and sewage treatment in Ipswich and both Anglian Water and Essex and Suffolk Water are the organisations responsible for water and sewage treatment in the IHMA. The water companies are required to invest in sewage treatment capacity with regard to an increase in population.
5.3 Suffolk County Council is the Lead Flood Authority and works via the Suffolk Flood Risk Management Partnership (SFRMP) to ensure that all agencies understand and manage flood risk within the county[49].Suffolk County Council is also is responsible for highway drainage, including puddles and blocked highway gullies. The Environment Agency is responsible for main rivers and tidal flood defences. Internal drainage boards (IDB) manage water levels in some areas of the country where there is a special need for drainage. These areas are known as internal drainage districts (IDD). The IDB relevant to the Ipswich Borough and Suffolk Coastal District is East Suffolk IDB. IDBs undertake works to reduce flood risk to people and property, and manage water levels for agricultural and environmental needs.
5.4 Planning authorities must have regard to the River Basin Management plan for their district in order to comply with legislation[50].
5.5 The East Suffolk IDB Drainage District District does not extend to its full catchment area, which means that it is more difficult to control development and flows of rivers coming into the Internal Drainage board District than if they had jurisdiction over the full catchment area. The water course responsibilities are shared therefore with the Environment Agency. The map outlined below identifies the parts of the river system that The East Suffolk IDB are responsible for. The red areas are IDB responsible areas.
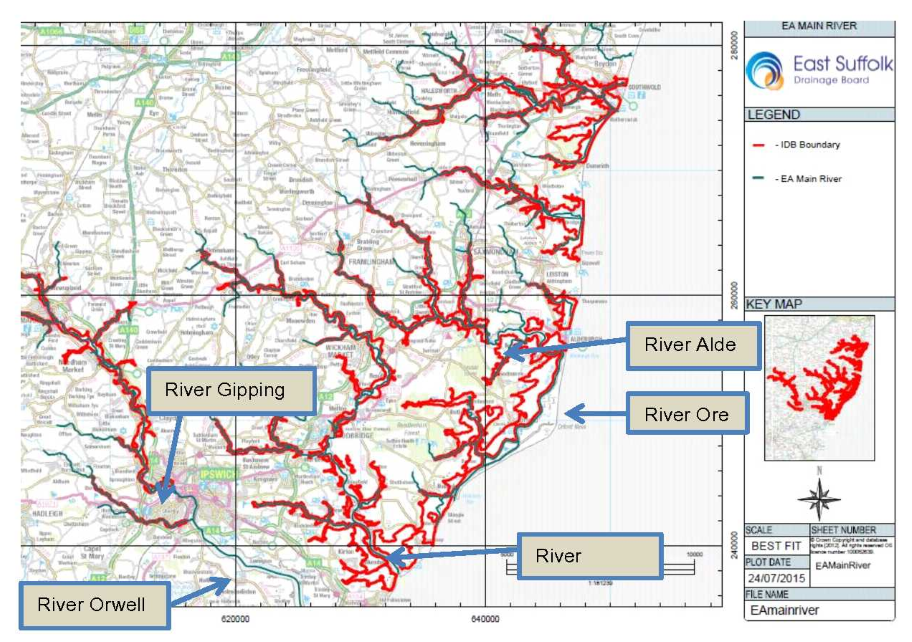
Figure 25: East Suffolk IDB areas of responsibility (shown in red)[51]
5.6 In terms of watercourse control, Ipswich Borough falls under the influence of the Environment Agency, although upstream from the Borough it is the Internal Drainage Board. There are currently no IDB schemes or maintenance which will impact on Ipswich Borough. All of the IDB district area controlled through the East Suffolk IBD lies outside the Borough of Ipswich around the edges. (CMT 187G – The Somerton Watercourse – which lies to the north west of Ipswich, and the CMT185G which lies to the south west).
Water Resources and Supply
5.7 There are two water companies operating in the IHMA. The Essex and Suffolk Water 'Water Resources Management Plan 2014' (WRMP) outlines its Water Resource Zones in Suffolk and Essex, forecasts water demand for the period 1 April 2015 to 31 March 2040, and documents how to meet this demand. Within Suffolk the company manages the are the Blyth, Hartismere, and the Northern/central Water Resource Zones (WRZ). The WRMP 2014 states all the water resource zones, including those covered in the IHMA, up to the end of the plan period of 2040 will be in surplus water supply.
5.8 The Anglian Water 'Water Resources Management Plan 2015' (WRMP) outlines its Water Resource Zones in Suffolk and Essex, forecasts water demand for the period 1 April 2015 to 31 March 2040, and documents how to meet this demand. Within Suffolk the company manages the East Suffolk, Sudbury and West Suffolk Water Resource Zones (WRZ). The WRMP 2015 shows that by 2039-2040, just beyond the plan period, both the East and West Suffolk WRZs will be in deficit by 1-10ml/day when comparing the average supply to demand. However, schemes are in place to address this shortfall e.g. water trading.
Sewage and Waste Water Treatment Works Capacity
5.9 Capacity for sewerage treatment varies between each town and village in the Ipswich Housing Market Area. The Haven Gateway Water Cycle Study Stage 1 Report identified issues with sewerage and waste water treatment in Ipswich. This issue has since been rectified. Further investment in Asset Management Period 7 (that is 2020-2025) will be considered to further increase capacity if necessary in line with the timing of the planned growth in Ipswich. In particular, works will be required to facilitate the accommodation of the garden suburb allocation. A Drainage Area Plan model for Ipswich has been completed in April 2015 by Anglian Water that will inform the final solution.
Water Quality
5.10 Much of the Ipswich Policy Area is covered by Nitrate Vulnerable Zones (NVZ). These are areas of land that drain into nitrate polluted waters or waters which have the potential to become polluted by nitrates. Farmers with land in NVZs must follow mandatory rules to tackle nitrate loss from agriculture. The majority of Suffolk Coastal, Babergh and Ipswich are covered by the Sandlings and Chelmsford existing groundwater NVZ (G78). This groundwater designation means water held underground in the soil or in pores and crevices in rock, which have or could have if action is not taken, a nitrate concentration greater than 50mg/l.
5.11 The Environment Agency has created 3 tranches of land that contain Nitrate Vulnerable Zones. The entire Ipswich Housing Market Area lies in Tranche 2, which means that farms situated in the tranche will be notified by the Environment Agency as to the impacts that this will have on farmland and the environment.
5.12 There are a number of Groundwater Source Protection Zones in the IHMA, which protect groundwater sources such as wells, boreholes and springs used for public drinking water supply. Source Protection Zones show the risk of contamination from any activities that might cause pollution in the area, which is important since groundwater provides a third of the drinking water on average in England and Wales and maintains the flow in many rivers. Figure 26 below illustrates the SPZs in the IHMA.
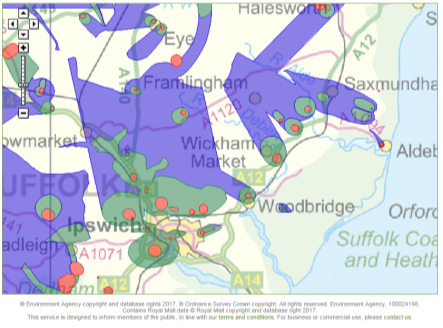
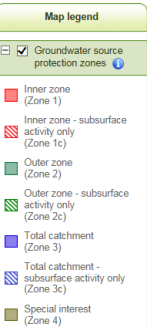
Figure 26: Water Quality in the IHMA
Future Considerations
- Greater recreational use of the River Orwell around the Ipswich waterfront e.g. free swimming, kayaking
- Climatic change
- Negative impacts on water quality through inappropriate development and farming practices
- Investment in waste treatment plants
Likely evolution of the baseline without the Local Plan
- Increased demand on water resources and sustainability of water supply
- Increased requirement for wastewater treatment
- Increased pollution in farmland and water courses
Key data sources
- Environment Agency data
- Water company data including Water Resource Management Plans
- Internal Drainage Board data
Key Issues for the Sustainability Appraisal
|
|
Key SA issue across Ipswich and Suffolk Coastal |
Ipswich Specific Issues |
|
Water |
Managing water resources and water quality |
There are a number of Groundwater Source Protection Zones High number of existing groundwater and surface water Nitrate Vulnerable Zones |
|
The timely provision of new water services infrastructure in line with growth |
The timely provision of new water services infrastructure in line with growth |
Table 18: Key Issues – Water
Air
Air Quality Management Areas
5.13 Ipswich Borough Council (IBC) is responsible for Local Air Quality Management (LAQM) in Ipswich. Ipswich Borough currently contains four Air Quality Management Areas (AQMAs), which have been designated as a result of the specific areas not meeting the air quality standards set out in the Government's revised Air Quality Strategy for England, Scotland, Wales and Northern Ireland (which was a direct response to the requirements of the Environment Act 1995). The strategy sets health based standards and objectives covering seven pollutants:
|
|
Table 19: Seven pollutants standards and objectives
5.14 The Act requires all local authorities to periodically review and assess air quality in order to determine whether the Air Quality Objectives will be met.
5.15 The Ipswich AQMAs have all been declared as a result of unsustainably high Nitrogen Dioxide (NO2) levels, predominantly relating to road vehicle exhaust emissions of oxides of nitrogen (NOx) at, or in the vicinity of busy road junctions. These are locations within Ipswich where road vehicle exhaust emissions cause ambient annual mean concentrations of nitrogen dioxide (NO2) to exceed the air quality objective of 40 micrograms per cubic metre (μg/m3). This objective is included in legislation for the protection of public health, and applies at the façades of residential premises, schools, care homes and hospitals; it does not apply at indoor locations, places of work, parks, gardens, on the footway nor within the roadway space where concentrations are highest.
These Air Quality Management Areas are:
- Norwich Road – Chevallier Street Junction (since 2006)
- St Margaret's Street – Crown Street (since 2006)
- Grimwade Street – St Helen's Street Junction – Star Lane gyratory (since 2006)
- Bramford Road/Yarmouth Road/Chevallier Street (since 2010)
They are depicted on Figure 27, overleaf.
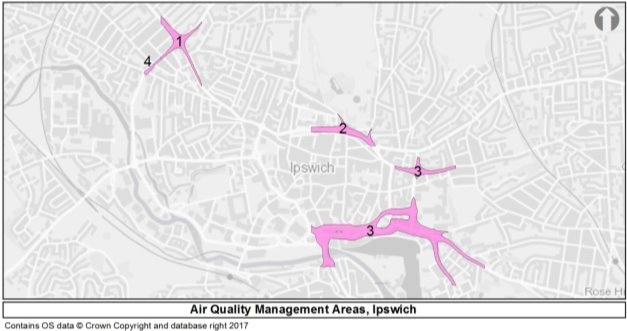
Figure 27: Air Quality Management Areas in Ipswich[52]
5.16 An Air Quality Action Plan, to implement measures to bring about improvements in local air quality, was introduced by IBC in 2008 and progress against this is reported annually.
5.17 IBC monitors the air quality in Ipswich using automatic monitors and numerous diffusion tubes across the town. Automatic monitors give an accurate representation of the levels of Nitrogen Dioxide at the monitoring station. Diffusion tubes are mounted on lamp-posts, signposts or buildings and give a reading of Nitrogen Dioxide over a four week period. The accuracy of diffusion tubes can vary by as much as 30% so they are generally used to identify long term trends.
5.18 Since the AQMAs were declared, continued monitoring has indicated that the annual average nitrogen dioxide level is now being exceeded at locations outside of these areas on St Matthews Street and Woodbridge Road. In addition to this, recent data has also identified small areas within existing AQMAs where annual average nitrogen dioxide is now at acceptable levels.
5.19 Taking this into consideration, and in recognition of the fact that the boundaries of existing AQMAs need to be reviewed on a regular basis to ensure that they remain relevant, the Environmental Health team are consulting on the declaration of a new AQMA (No. 5) at St Matthews Street / Norwich Road between the Civic Drive roundabout and Bramford Road and changes to the existing AQMAs to reflect monitoring results.
5.20 IBC will make a decision on new AQMA boundaries in 2017. It will also undertake source apportionment work (to identify what is causing the air pollution) and publish its Air Quality Action Plan this year.
Trends in Air Quality
5.21 IBC published a report on air quality in May 2016, to provide evidence for the 2011 – 2031 Ipswich Local Plan Examination in Public. This report stated:
"Given the evidence of falling trends in annual mean NO2 concentrations in the IBC area and improvements in vehicle emissions as older more polluting vehicles are progressively replaced by vehicles with more stringent Euro 6 type approval for exhaust emissions, it is expected that ambient concentrations near to roads will be lower in the future than they are at present…Risk of non-compliance in the future will be greatest at locations on the road network where junctions are likely to be at or near capacity in terms of traffic. Future developments within the IBC area will add to traffic on the local road network and - whilst individual vehicles are likely to give rise to lower emissions of NOx and other pollutants - the additional number of vehicles on the road may give rise to congestion at particular junctions with the potential for elevated ambient pollutant concentrations."
5.22 The report concluded that it would be possible to mitigate for any negative impacts through highways based measures, measures to encourage modal shift, continuing technological improvements, consideration of an air quality neutral policy and setting minimum NOx emissions standards for developers for all new boiler and combined heat and power (CHP) plant.
5.23 The Government has recently consulted on its plan "Improving air quality: reducing nitrogen dioxide in our towns and cities." This is a "revised Plan to reduce levels of nitrogen dioxide around roads within the shortest possible time." It also included principles which local authorities should follow when setting up Clean Air Zones in England.
Low Emissions Policies and Initiatives
5.24 Ipswich Borough will produce a Low Emissions Supplementary Planning Document (SPD) in the Autumn. This SPD will provide consistency in the approach to dealing with air quality and planning in Ipswich. Specifically, it will provide guidance on measures that can be implemented to mitigate the potentially harmful impacts of new developments (e.g. in terms of increased vehicles and congestion or on-site heating), provide guidance on the use of planning conditions and Section 106 obligations to improve air quality and provide guidance on the requirements of air quality assessments/low emission strategies and the circumstances under which these will be required.
5.25 Authorities in other areas of the UK are also tackling air quality through a number of measures such as;
- Low Emission Zones (LEZs) and Ultra Low Emission Zone (ULEZs)
- Adoption of car free developments
- Provision of cycling facilities and infrastructure
- Provision of infrastructure for low emission vehicles such as electric vehicle recharging points
- Car free days
- Sustainable building design e.g. boiler design and operation
Key Projects
5.26 Suffolk County Council (SCC) is undertaking air quality studies as part of the following wider transport/infrastructure projects;
- Junctions on the A14 around Ipswich
- Options for Ipswich northern routes
- Ipswich radial routes
- The Upper Orwell Crossings
Future considerations
- Will the definition of receptors change? It currently the façades of residential premises, schools, care homes and hospitals; it does not apply at indoor locations, places of work, parks, gardens, on the footway nor within the roadway space (where concentrations are highest).
- Will the technological advances deliver the air quality benefits?
- What will be the rate of uptake of new technologies and what infrastructure will this require?
- Will the way we travel change radically e.g. autonomous vehicles, movement as a service.
- Further repercussions from the diesel emissions scandal
Likely evolution of the baseline without the Local Plan
- Increase in vehicular traffic and potential for increased air pollution in the first part of the plan period
- Risk of increased pollution if the infrastructure does not support cleaner vehicles
Key data sources
- Air quality monitoring undertaken by Ipswich Borough Council and partners[53]
- County-wide transport model
- Developers' Transport Assessments
- Major projects' data
- Ipswich Annual Monitoring Report
Key Issues for the Sustainability Appraisal
|
|
Key SA issue across Ipswich and Suffolk Coastal |
Ipswich Specific Issues |
|
Air |
Improving air quality |
Congestion at various locations in the town centre and associated air quality issues There are currently four Air Quality Management Areas in Ipswich |
|
The requirement for clean vehicle infrastructure to encourage uptake of technologies |
The requirement for clean vehicle infrastructure to encourage uptake of technologies |
Table 20: Key Issues - Air
Material Assets (including Soil and Waste)
Soil and Minerals
5.27 Sand and gravel are the main minerals worked in Suffolk. Small amounts of chalk for agricultural and industrial purposes are also extracted. Suffolk imports hard rock primarily by rail from outside the region (mainly from the East Midlands) with rail facilities at Gazeley, Barham, Ipswich and Bury St Edmunds. Figure 28 overleaf gives more details on the mineral resources in the IHMA.
5.28 The LAA (Local Aggregate Assessment) concludes that there are adequate reserves of indigenous sand and gravel at the present time to comply with the requirement of the NPPF to have a land bank of permitted reserves of at least 7 years. In 2014, 50-60% of the sand and gravel consumed in Suffolk (915,000 tonnes) was produced in Suffolk (including marine dredged). Most of the balance comes from Essex and Norfolk.
5.29 It is national policy to sustainably use minerals that are excavated as locally as possible. Half and up to nearly two thirds of minerals excavated in Suffolk are used in Suffolk. In addition it is also national policy to re-use existing mineral aggregates first before excavating more.
5.30 There are large marine aggregate resources present off the coast of Suffolk however it is not County Council policy to seek to increase reliance on marine dredged aggregates in order to reduce the amount of land won aggregate it needs to provide for. Nevertheless, with the large national infrastructure projects planned in Suffolk including Sizewell C, the County is seeking to maximise the potential for the use of marine dredged and sea borne aggregate for the construction of this development.
5.31 There are wharves in Ipswich and Lowestoft, which have the capacity to handle marine dredged (and marine borne) aggregate. Currently marine dredged aggregate and marine borne material can be handled at Ipswich at the West Bank terminal on Ipswich Docks with provision for marine borne material to be landed on the East Bank alongside a recently constructed concrete batching plant off Cliff Reach.
5.32 There is a Marine aggregate storage area at Griffin Dock to the south of New Cut West. In addition, there is a tarmac road stone plant adjacent to Cliff Reach; and a concrete batching plant at Portman Walk.
5.33 Suffolk County Council is in the process of developing a combined Minerals and Waste Local Plan, which will detail policies for minerals and waste, and set out locations for the potential development of minerals sites (such as sand or gravel pits) and waste sites (such as recycling plants or landfill sites) in the county. Aggregates from these sand and gravel sites (or quarries) are mainly used for the building of new homes, and other construction projects. Sand and gravel resources in Suffolk require replenishment, to meet the needs of the construction industry. A call for new sand and gravel sites is included within the Issues & Options document. Preferred sites will be consulted upon later this year. The Minerals and Waste Plan will make provision for minerals and waste development until 2036 which aligns with the timescale for the new local plan for Ipswich.
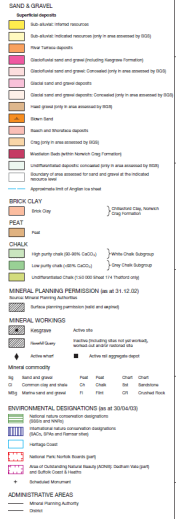
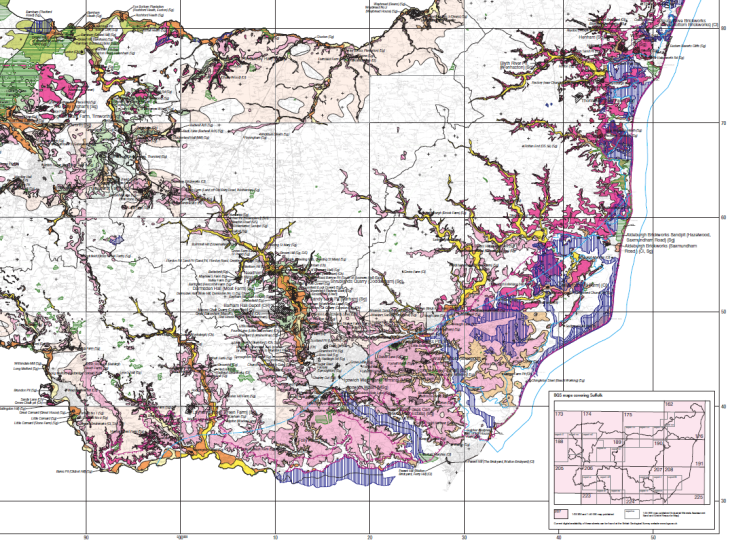
Figure 28: Mineral resources in the IHMA (British Geological Survey. 2003)[54]
5.34 Minerals Consultation Areas are strongly concentrated within both Suffolk Coastal and Babergh, while Ipswich and Mid Suffolk contain very little Minerals Consultation Areas by comparison.
5.35 There are currently no Minerals Safeguarding Areas (MSAs) in Ipswich although there are a small number of minerals related businesses that are privately owned. (These areas help define where there are mineral reserves of local and national importance under the ground and is designed through the consultation on planning applications to make sure that these broad areas are not needlessly sterilised from future mineral development by other forms of development whilst not creating an assumption that the resources that are defined will be worked.) There are two MSAs within the IHMA. These are located in the following areas;
- Adjacent to the A14 to the south of Needham Market and north of Claydon; and
- South of Ipswich and to the north of the A14
5.36 The majority of Suffolk Coastal is covered by different types of sand and gravel deposits, which are as follows. A section of 'Sub-alluvial sand and gravel' runs along the main river systems, 'glacial sand and gravel' deposits are located in the South East of the district. Just north of Woodbridge there is a large swathe of 'glaciofluvial sand and gravel', which runs along the Eastern half of the district. There is also an area of 'crag' situated in the South Eastern part of the district. Suffolk Coastal contains a variety of different sand and gravel resources overall and in particular along the Eastern part of the district.
5.37 Babergh maintains a similar mineral landscape to Suffolk Coastal, though on a slightly smaller scale. Mid Suffolk is bare of minerals in the middle, although the northern part of the district contains a large swathe of 'glacial sand and gravel deposits'. In addition, a pocket of 'high purity chalk' lies in the southern corner.
Geology
5.38 Three of the Ipswich's SSSIs are designated for their geological interest. In addition, Suffolk has eight Regionally Important Geological and Geomorphological Sites (RIGS), which are the most important places for geology and geomorphology outside statutorily protected land such as SSSI (see Figure 29, overleaf). There are also 13 sites designated as County GeoSites, these non-statutory designations aim to highlight their local importance. Within Suffolk Coastal there are 14 Regionally Important Geological and Geomorphological Sites and GeoSites (RIGS & CGS).


Figure 29: Shows Regionally Important Geological and Geomorphological Sites and County GeoSites[55]
Agricultural Land
5.39 Defra's Agricultural Land Classification (ALC) system assesses the quality of farmland and divides it into five categories. The 'best and most versatile land' is defined by the NPPF as that which falls into Grades 1, 2 and sub-grade 3a and should be protected unless it is in the public interest not to do so.
5.40 Ipswich has little farmland in its administrative boundary and this is classified as Grade 2 ('Very Good') quality agricultural land. Agricultural land surrounding Ipswich Borough within the IHMA is formed of Grade 2 in pockets to the north and south and west and is largely Grades 3 and 4 with some non-agricultural land.
5.41 The majority of the rural areas within the IHMA as designated as 'good to moderate' agricultural land, shown as green in figure 30 overleaf. Light blue areas of the map are dotted within the green areas and represent 'very good' agricultural land use. The red areas represent 'land predominantly in urban use', which with the exception of Ipswich is very sparse.
5.42 It is apparent that the majority of the rural areas across the IHMA are deemed as "good to moderate" with a variety of land classified as "very good" or "excellent". Suffolk Coastal contains areas of land that is deemed "poor". These areas are predominantly in the coastal and estuarine locations.
Figure 30: Agricultural land grades across the IHMA
Previously Developed Land
5.43 It is a government objective for the majority of development to be located on previously developed land as long as it is not land of high environmental value[56]. The average percentage of housing built on previously developed land in Ipswich from 2001/02 to 2013/14 was 92.9%. All local authorities are required to produce brownfield (previously developed land) registers by 31 December 2017. For Ipswich Borough, this work is ongoing.
5.44 The table below displays the gross percentage of housing completions on previously developed land (PDL). It is clear that Babergh and Mid Suffolk have much higher figures than Suffolk Coastal. This may be due to the limited opportunities for development on PDL in Suffolk Coastal. Ipswich has the highest figures for housing completions on PDL, which is to be expected of an urban environment.
|
|
12/13 |
13/14 |
14/15 |
15/16 |
|
Babergh gross % PDL |
31 |
29 |
37 |
59 |
|
Mid Suffolk gross % PDL |
- |
- |
33 |
46 |
|
Suffolk Coastal gross % PDL |
38 |
22 |
18 |
14 |
|
Ipswich gross % PDL |
63 |
83 |
90 |
73 |
Table 21: Percentage of housing completions on previously developed land (AMR. 2016)[57]
5.45 Although in 2015/16 the number of housing completions was nearly double that of 2013/14 and 2014/15, the percentage figure is less because of the much higher total completions in 2015/16.
|
|
12/13 |
13/14 |
14/15 |
15/16 |
|
Number of new dwellings completed on PDL / gross completions in Suffolk Coastal |
124/324 |
48/215 |
46/427 |
77/564 |
Table 22: Housing completions on previously developed land in Suffolk Coastal (AMR. 2016)29
Contaminated Land
5.46 The Ipswich Contaminated Land Strategy explains how IBC implements its duties outlined in the Government's Contaminated Land legislation. The strategy was last reviewed and updated in 2013. At present there are no sites registered as contaminated land under Part IIA of the Environmental Protection Act 1990. However over 200 sites have been identified as potentially being contaminated and require further investigation.[58] The Council has however achieved significant clean-up of land contamination via the Planning process.
Waste
5.47 The Waste Management Plan for England[59] sets out the Government's ambition to work towards a more sustainable and efficient approach to resource use and management. Waste planning authorities should identify, in their Local Plans, sites and/or areas for new or enhanced waste management facilities in appropriate locations. The waste hierarchy in figure 31 overleaf outlines the approach that local waste planning authorities need to take regarding waste disposal.
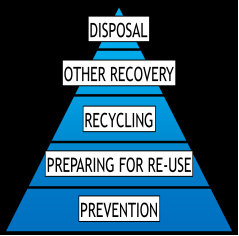
Figure 31: The Waste hierarchy
5.48 Suffolk County Council is responsible for waste management (disposal); however Ipswich Borough, Suffolk Coastal District and Babergh District Councils are the waste collection authorities. Local authority collected waste statistics for the Ipswich indicate that a total of 515.82 tonnes of residual waste was collected in 2015/16 this represents 59.20%of waste collected and the level of residual waste (waste that is not composted or recycled) is increasing which is also a national trend.
5.49 A new energy-from-waste facility has been completed at Great Blakenham near Ipswich in 2014, which is expected to run for the next 25 years. In 2015/16 21.82% of waste collected was recycled and 17.94% was composted. These figures have remained static for the last few years.[60] Recycling rates are also lower than the national average of a 31% in 2016.[61] No waste was sent to landfill. The Energy from Waste (EfW) plant at Great Blakenham handles all of Suffolk's residual municipal waste and an element of residual Commercial and Industrial waste. The EfW facility is expected to run until 2039.
5.50 Suffolk County Council is in the process of developing a combined Minerals and Waste Local Plan, which will detail policies for minerals and waste, and set out locations for the potential development of minerals sites (such as sand or gravel pits) and waste sites (such as recycling plants or landfill sites) in the county. The county is also updating the radioactive waste policy to fit with national policy guidelines, and a new draft policy on the proposed criteria for the safe recovery of materials from existing landfill sites in the new plan. Waste planning authorities should identify, in their Local Plans, sites and/or areas for new or enhanced waste management facilities in appropriate locations. Preferred sites will be consulted upon later this year.
5.51 There are limited existing potential sites in Ipswich Borough Council administrative area. There is only the Materials waste recycling plant on Sir Alf Ramsey Way/West End Road. Ipswich Borough Council supports the relocation of this waste transfer station from its current location.
5.52 The new waste transfer station for municipal waste granted under 14/00840 between Lyham Road and the A14 (on land owned by the county council) has not yet been built. This is likely to remain unbuilt until the restoration scheme at the Foxhall site has been completed.
5.53 The former sugar refinery premises at Sproughton Road, Sproughton is owned by IBC and the County Council is proposing to remove this site, allocated in the existing Waste Local Plan (2011), from the new SM&WLP. It was identified as an area suitable for use as a strategic residual waste treatment facility. This site was formerly occupied by a sugar refinery, which processed sugar beet from the surrounding area into sugar and other sugar products. The overall site area is 34.4ha and 5ha is required for the residual waste treatment facility.
5.54 According to the Suffolk Minerals and Waste Development Plan Annual Monitoring Report 2014/15 there were over 100 live waste management facilities in the county as follows;
- 14 household waste recycling centres;
- 6 composting sites (or compost processing sites);
- 13 landfill sites – overtaken now by the energy from waste facility at Great Blakenham;
- 28 waste transfer facilities;
- 25 metal recycling facilities;
- 1 materials recovery facility;
- 9 incinerators (which are mainly small veterinary facilities); and
- 3 anaerobic digesters
5.55 In Ipswich, waste management facilities include a number of household waste recycling centres, a materials recovery facility, waste transfer stations, biomass and recycling facilities.
5.56 All of the authorities in the Ipswich Housing Market Area are members of the Suffolk Waste Partnership (SWP), a group of local authorities throughout Suffolk that actively work together to continuously improve waste management services. The SWP's Joint Municipal Waste Management Strategy (2003-2020), sets out a strategy for dealing with the increasing volumes of municipal waste (household and commercial waste). In 2006/07 the county produced 418,466 tonnes of municipal waste.[62]
5.57 Figure 32 shows the percentage of household waste that has been sent for re-use, recycling, or composting in each district between 2009 and 2015. Notable are the higher percentages for Suffolk Coastal when compared to the other authorities. Suffolk Coastal averages 55.78% across the years measured, which is much higher than the averages for Babergh (41.59%), Mid Suffolk (41.59%), and Ipswich (41.44%).
5.58 It uses household and business waste, which would
otherwise go to landfill, as a fuel to generate enough
electricity for 30,000 homes. 
Figure 32: Percentage of household waste sent for
re-use, recycling or composting (Suffolk Observatory.
2015)[63]
Future Considerations
- Suffolk County Council Waste and Minerals Plan
- Energy from waste
- A move to a 'circular economy', whereby resources are kept in use for as long as possible to extract the maximum value from them whilst in use, then recover and regenerate products and materials at the end of their lives. It is an alternative to a traditional make-use-dispose model.
- The Energy from Waste (EfW) plant at Great Blakenham handles all of Suffolk's current residual municipal waste and an element of residual Commercial & Industrial waste and is expected to run until 2039
- The EfW plant also currently processes waste from outside of the county. Can it continue to do so with the proposed level of employment and housing growth in the county and specifically the IHMA.
Likely evolution of the baseline without the Local Plan
- Applications will be determined under the NPPF
- Existing planning policy prioritises new development on brownfield land
- Population increase will increase waste generation
- Development itself may place pressure on local mineral assets to support construction (as well as demand from outside of the IHMA). This will be managed through the county's function for waste and minerals planning, which would be reinforced by any supporting Local Plan policies.
Key data sources
- Suffolk Observatory
- Suffolk Coastal AMR and Ipswich AMR
- British Geological Survey
- Annual minerals and waste monitoring reports from Suffolk County Council
- Suffolk Waste Partnership
- National waste annual data collection for households 2015/16 – ENV18 (DEFRA)
- IBC 2016-2017 Business Plan Culture and Environment (July 2017)
- IBC Contaminated Land Strategy 2013-18
- National Waste Strategy 2014
- The Waste Management Plan for England
Key Issues for the Sustainability Appraisal
|
|
Key SA issue across Ipswich and Suffolk Coastal |
Ipswich Specific Issues |
|
Material Assets (including soil and waste) |
The need to maintain and/or enhance soil quality |
The need to remediate contaminated sites and avoid contamination. Very little high quality agricultural land remaining. |
|
The need to manage waste arisings in accordance with the waste hierarchy |
The need to manage waste arisings in accordance with the waste hierarchy |
|
|
The need to encourage development on previously developed land and/or make use of existing buildings and infrastructure |
The average percentage of housing built on previously developed land in Ipswich from 2001/02 to 2013/14 was 92.9%. |
|
|
The need to protect and enhance sites designated for their geological interest |
The need to protect and enhance sites designated for their geological interest |
Table 23: Key Issues – Material Assets (including soil
and waste)
Climatic Change and Flooding
Carbon Emissions
5.59 Table 24 below, shows the estimated CO2 emissions (tonnes per person) from 2005 to 2014 for each of the authorities making up the IHMA, as well as Suffolk County as a whole. The data indicates that per capita CO2 emissions have been much lower in Ipswich than the other authorities in every year from 2005 – 2014. This may be explained by the fact that people living in Ipswich have greater access to public transport, and are more likely to be in walking and cycling distance of key services when compared to the rural areas of the district. The table also shows a clear reduction in per capita CO2 emissions since 2005, a drop of almost 2 tonnes per person across Suffolk as of 2014, from 8.0 in 2005 to 6.1 in 2014. The largest drop recorded has been experienced in Mid Suffolk.
|
|
2005 |
2006 |
2007 |
2008 |
2009 |
2010 |
2011 |
2012 |
2013 |
2014 |
|
Suffolk Coastal |
7.6 |
7.6 |
7.2 |
7.0 |
6.6 |
6.7 |
6.1 |
6.6 |
6.4 |
5.8 |
|
Babergh |
8.3 |
8.2 |
7.9 |
8.0 |
7.2 |
7.6 |
6.9 |
7.2 |
7.0 |
6.4 |
|
Mid Suffolk |
9.4 |
9.3 |
8.9 |
8.5 |
7.9 |
8.2 |
7.7 |
7.7 |
7.5 |
6.9 |
|
Ipswich |
5.7 |
5.6 |
5.4 |
5.2 |
4.6 |
4.8 |
4.1 |
4.3 |
4.2 |
3.7 |
|
Suffolk |
8.0 |
8.0 |
7.6 |
7.3 |
6.9 |
7.4 |
6.5 |
6.8 |
6.7 |
6.1 |
|
England |
8.5 |
8.4 |
8.2 |
8 |
7.1 |
7.3 |
6.7 |
7 |
6.7 |
6 |
Table 24: per capita CO2 emissions (tonnes per person)[64]
5.60 During this period and within Ipswich sectors in which levels of CO2 have been reduced are shown to be mainly in the Industry and Commercial sector where there was a 38.3% reduction in emissions. Domestic emissions reduced by 28.6%, and transport by 15.4% over the same period.
|
Indicator 2.2 - Ipswich Carbon Emissions from 2005 – 2014 |
|||
|
|
Industry and Commercial |
Domestic |
Transport |
|
2005 |
309.5733 |
278.818 |
130.894 |
|
2006 |
298.8272 |
279.8874 |
130.013 |
|
2007 |
281.1604 |
273.4417 |
131.9013 |
|
2008 |
273.5683 |
270.8244 |
127.6542 |
|
2009 |
238.3469 |
244.0892 |
123.3994 |
|
2010 |
248.1285 |
262.6769 |
122.7748 |
|
2011 |
209.6653 |
229.7059 |
119.4005 |
|
2012 |
224.1721 |
248.0059 |
109.2205 |
|
2013 |
223.3596 |
237.859 |
107.7927 |
|
2014 |
190.7453 |
199.0156 |
110.7609 |
|
% change since 2005: |
-38.38% |
-28.62% |
-15.38% |
Table 25: Ipswich Carbon Emissions (2005-2014)
Renewable Energy
5.61 Table 26 depicts the number of renewable energy installations for the Ipswich Housing Market Area authorities as well as the East of England and England. The number of domestic photovoltaics per 10,000 households in Ipswich is almost a third of the number recorded in the other authorities across the Housing Market Area. The Ipswich figure falls well below the East of England and below the national figures. In addition, the number of domestic photovoltaics per 10,000 households in Suffolk Coastal (606), Babergh (675), and Mid Suffolk (627) all occupy positions of more than double the national figure (275) and almost double the figure for the East of England (355).
5.62 This may be a result of the lack of space in the urban area compared to that of the more rural authorities. It is suggested that orientation and tilt are probably the most important factors affecting Solar PV system efficiency. Maximum efficiencies are achieved at a tilt of about 35 degrees with an orientation due south. Shadowing caused by high density development may be an issue. [65]It may also be a consequence of the economic situation of households in the more affluent parts of the Housing Market Area.
|
Renewable Energy |
Suffolk Coastal |
Babergh |
Mid Suffolk |
Ipswich |
East of England |
England |
|
Domestic Photovoltaics |
3,319 |
2,584 |
2,620 |
1,310 |
88,863 |
624,173 |
|
Domestic Photovoltaics (per 10,000 households) |
606 |
675 |
627 |
222 |
355 |
275 |
|
Domestic Wind |
65 |
4 |
53 |
0 |
682 |
2,050 |
|
All Wind |
68 |
6 |
61 |
0 |
800 |
3,433 |
Table 26: Renewable energy installations (Suffolk Coastal. 2016)33
Flooding
5.63 Suffolk County Council is the Lead Local Flood Authority as defined in the Flood and Water Management Act 2010. Their Suffolk Flood Risk Management Partnership web page includes the Local Flood risk Management Strategy which helps everyone understand and manage flood risk within Suffolk. The web page also provides guidance for developers on sustainable drainage and a protocol which explains Suffolk County Council's role as a statutory consultee in the planning process regarding surface water drainage and local flooding related to major development proposals.
5.64 Many buildings in Ipswich are at risk of flooding, some from tidal surges and many from heavy rain. This risk will continue to grow as a result of rising sea levels and increasingly heavy rainstorms that can overwhelm drainage systems and cause localised flooding unless mitigation measures are implemented. At the strategic scale, tidal flood risk will be tackled through the completion of the Ipswich Flood Defence scheme including a tidal surge barrier. However developments located within the flood plain will still need to address residual risk in accordance with the National Planning Policy Framework (e.g. the risk of defences failing).
5.65 Some of central Ipswich is within the floodplain and therefore flooding issues are of particular importance. IBC has been working with the Environment Agency (EA) and other partners on an Ipswich Flood Defence Management Strategy. The first stage of this project was completed in December 2008, which saw the replacement of flood gates at the Wet Dock Lock. Construction of the East and West Bank flood defence walls was completed in early 2011. A tidal surge barrier across the River Orwell is the main part of the strategy and this will safeguard the town from a one in 300 chance of flooding in any one year due to a tidal surge. The barrier across the New Cut, opposite the Island site is under construction and will be completed in 2018.
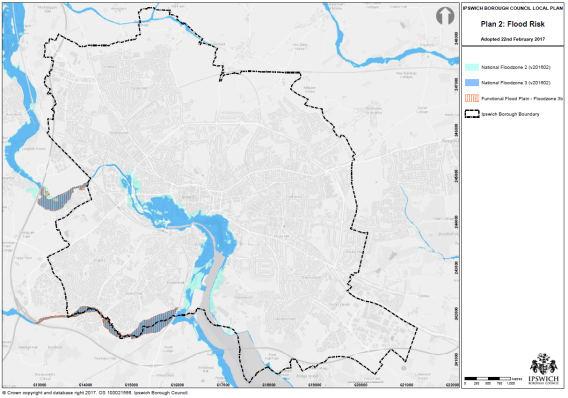
Figure 33: Flood risk in Ipswich Borough[66]
5.66 Planning Practice Guidance (PPG) defines the probability of flooding through the implantation of flood zones, which are as follows;
- Flood zone 3b is the functional floodplain and as such is where water is stored during flooding.
- Flood zone 3a areas are defined as having a high probability of flooding and comprise land that has a 1 in 100 (>1%) or greater annual probability of river flooding.
- Flood zone 2 areas are defined as having a medium probability of flooding and comprise land that has between a 1 in 100 and 1 in 1000 (1%-0.1%) annual probability of river flooding.
- Flood zone 1 is the lowest classification and lowest probability of flooding and comprises land that has a less than 1 in 1000 (<0.1%) annual probability of river flooding.
5.67 The Ipswich Level 2 Strategic Flood Risk Assessment (SFRA) provides the necessary information to help facilitate the sequential approach as outlined in the NPPF. The Council's Level 2 SFRA provides information relevant to both the existing tidal/fluvial defences at 2011 and also to the completed defences, with the proposed barrier in place. In each case the SFRA provides data on residual risks taking account of flood depth and the velocity of floodwater. The preparation of many site-specific FRAs can make use of mapped risks from the new SFRA. However in some instances, site specific FRAs will still need to include detailed flood modelling to ascertain the flood risk.
5.68 The SFRA also considers the effects of development on local flooding and minor watercourses and identifies mitigation measures including SuDS, rainwater harvesting, storage, the use of green roofs and the role of trees in intercepting rain in heavy rainstorms and to help alleviate flooding.
5.69 Within the IHMA, settlements in or near to flood zone 3b are as follows; Earl Soham, Felixstowe, Knodishall, Melton, Peasenhall, Saxmundham, Wickham Market, Woodbridge, and Yoxford.[67] The coastal nature of Suffolk Coastal District puts it at greater risk than other districts of the IHMA
Sustainable Design
5.70 The National Planning Policy Framework requires local planning authorities to support the move to a low carbon future and when setting any local requirements for a building's sustainability, to do so in a way consistent with the Government's zero carbon buildings policy and adopted nationally described standards. Policies should be designed to maximise renewable and low carbon energy generation whilst addressing any adverse impacts satisfactorily, including cumulative landscape and visual impacts.
5.71 Through the Housing Standards Review the Government has introduced powers for planning authorities to require 'optional' standards for water efficiency. The East Anglian area is identified as an area of 'severe water stress' and lowering water demand is identified as one of a range of measures to balance supply and demand in the Anglian Water Resources Management Plan 2015. The optional standard requires development to meet water efficiency standards of 110 litres/person/day (compared to Building Regulations requirements of 125 litres/person/day). It is set out in Part G of the Building Regulations.[68]
Functional Ecosystem
5.72 Plants and trees have a number of roles to play in mitigating the effects of climate change, for example;
- Vegetation can absorb CO2 from the atmosphere, acting as a 'carbon sink';
- Trees, green roofs, and other vegetation can help reduce urban heat island effects by shading building surfaces and the public realm, deflecting radiation from the sun, and releasing moisture into the atmosphere; and
- Vegetation can slow and temporarily store 'runoff' which is the rainfall that flows over hard ground surface e.g. roads, driveways, car parks, rooftops and other paved surfaces into drains. This decreases flooding and erosion downstream.
Future Considerations
- The impact of the US withdrawal from the Paris Agreement
- The demise of fully functional floodplains
- Potential for increased uptake of existing technologies e.g. ground and air source heat pumps in residential buildings, photovoltaics.
- The advent of new technologies
- More frequent extreme weather events and flooding linked to climate change
Likely evolution of the baseline without the Local Plan
- Reduction of emissions of carbon dioxide (CO2) lies at the heart of the vision and objectives set out in the current Ipswich Local Plan.
- Flood defences in Ipswich are being upgraded and work on this will be completed this year.
- Lack of take up of renewable technologies without appropriate infrastructure and support
- Increasing development may heighten flood risk if not appropriately managed.
- The current Local Plan requires new build residential development to meet water efficiency standards of 110 litres/person/day and developments are expected to incorporate sustainable drainage and water efficiency.
Key data sources
- Environment Agency data on flooding
- Central Government monitoring of annual carbon emissions for each local authority.
- Ipswich Strategic flood risk Assessment.
- Suffolk Observatory
- http://www.solarpv.co.uk/solar-pv-orientation.html
Key Issues for the Sustainability Appraisal
|
|
Key SA issue across Ipswich and Suffolk Coastal |
Ipswich Specific Issues |
|
Climatic Change |
The need to ensure that the built environment adapts to the impact of climate change and extreme weather events |
The need to increase renewable energy provision and deliver carbon neutral development. The need to ensure sustainable construction techniques and green infrastructure are employed to mitigate climate change and address fuel poverty. |
|
The need to address pluvial, fluvial and coastal flood risk |
Ipswich has a Flood Defence Management Strategy including a tidal surge barrier which will be completed this year. |
Table 27: Key Issues – Climate change
The Coast and Estuaries
Estuary Management
5.73 There are four estuaries within the IHMA, these being the Stour and Orwell, the Alde-Ore, the Deben, and the Blyth. The Stour and Orwell Estuary lies partly within the boundaries of Ipswich Borough, although those living in Ipswich also frequently visit the Alde-Ore and the Deben estuaries.
The Stour and Orwell Estuaries
5.74 The Stour and Orwell Estuaries, as discussed in the Essex and South Suffolk Shoreline Management Plan 2[69], are of international environmental importance. The estuaries make up a varied landscape including extensive mudflats, low cliffs, saltmarsh, and areas of vegetated shingle. The estuaries are designated as a Special Protection Area, a Site of Special Scientific Interest, and a Ramsar and this site lies partly within Ipswich Borough. The site also lies within the Suffolk Coasts and Heaths AONB and is included within the Natura 2000 European Marine Sites. Hence it is vitally important that the estuaries are protected from coastal erosion, and flooding. The estuaries are to be supported to enhance their natural evolution while continuing to defend all existing dwellings and infrastructure.[70] From Felixstowe to Ipswich the coastal management policies along the northern bank of the Orwell in the short, medium, and long term are as follows; 'Advance the Line', 'Hold the Line', 'Managed Realignment', and 'No active intervention'.[71]
5.75 The Orwell Estuary provides an important ecological network and landscape setting for Ipswich and helps define its history. It is characterised by its broad expanse of water and its gently rolling, wooded banks. The transition between the built-up character of Ipswich and open countryside is quite sharply defined around most of the present Borough boundary, with the transition from urban to rural appearance and uses being clearly appreciable. The Orwell Estuary will be covered by the South East Inshore Marine Plan when it is completed. This will set out priorities and directions for future development within the plan area, inform sustainable use of marine resources, and help marine users understand the best locations for their activities, including where new developments may be appropriate. An East Inshore and Offshore Marine Plan was adopted on 2nd April 2014 which covers an area adjacent to the Suffolk Coast north of the River Orwell. Early consultation with the Marine Management Organisation will be required where any work requiring consideration under the MarineWorks (Environmental Impact Assessment) Regulations 2007 is to be undertaken.
The Alde-Ore Estuary
5.76 At 16 miles in length the Alde-Ore Estuary is the longest in Suffolk. It runs behind the shingle spit at Orford, and is the only bar-built estuary in the UK with a shingle bar. The estuary contains large areas of mudflats, saltmarshes, as well as vegetated shingle habitats, grasslands, and reed beds. The Natura 2000 citation states the estuary is one of the best in the UK for mudflats and sandflats not covered at low tide. The Estuary is within the Heritage Coast, as well as the Suffolk Coasts and Heaths AONB. These designations aim to enhance and conserve the nationally significant features of the estuary. Hence it is important that the estuary is protected from both human developments as well the environmental threats of for example flooding and sea level rise. The current policy is to maintain the existing defences at Aldeburgh and through to the Martello Tower, and operate an overall approach of resilience.[72] The estuary runs along the coast behind the Shingle Street for a considerable distance and so has two management designations, 'No Active Intervention' in the Southern section and 'Hold the Line' in the Northern part of the coast.
The Deben Estuary
5.77 The Deben estuary stretches from Felixstowe to the furthest tidal limit inland near Woodbridge. Most of the estuary lies within the Suffolk Coasts and Heaths AONB. Part of the estuary, between Felixstowe Ferry and Bromeswell, is designated as a Special Landscape Area. Within the estuary 1300 properties are at differing risks of tidal flooding.
5.78 In the short term the policy is to improve the defences at Bawdsey manor consistent with maintaining the Deben Estuary mouth configuration. Furthermore, protection is being maintained in areas of the Felixstowe Ferry frontage that are of particular vulnerability to flooding. In the medium term the policy option is to continue maintaining the current flood defences along the estuary. In the long term the policy approach is to maintain, improve, and adapt the defences along the estuary.[73] Hence, overall the coastal management policy for the Deben estuary is to 'Hold the Line'.
Future Considerations
- East Anglia is one of the fastest eroding coastlines in Europe and hence the coastline is vulnerable to coastal erosion.
- Coastal properties may become damaged or destroyed by coastal erosion.
- Deterioration of the wildlife in estuaries and rivers.
- Changes in leisure activities affecting the coasts and estuaries
- The impact of increased tourism including the England Coastal Path
Likely evolution of the baseline without the Local Plan
- Babergh district, Suffolk Coastal District and Ipswich Borough Councils are developing a strategy to ensure that pressure from increased recreation can be avoided and mitigated for. This relates to development proposed in the current plan periods and is required to ensure that the Local Planning Authorities meet their duties under the Conservation of Habitats and Species Regulations 2010, commonly known as the 'Habitats Regulations'.
Key data sources
- SBIS
- Stour and Orwell Estuaries Management Group
- AONB
- The Deben Estuary Plan.
- Alde-Ore Estuary partnership.
- The Stour and Orwell Scheme of Management.
Key Issues for the Sustainability Appraisal
|
|
Key SA issue across Ipswich and Suffolk Coastal |
Ipswich Specific Issues |
|
The Coast and Estuaries |
The need to manage pressure on protected sites |
Large areas protected for species and habitat value which come under pressure from increased recreational and tourist activity |
Table 28: Key Issues - The Coast and Estuaries
Biodiversity
Accessible Greenspace
5.79 The Haven Gateway Green Infrastructure Strategy for the Ipswich Policy Area provides a list of existing and proposed accessible natural greenspace over 2ha in the wider IPA. The table below represents the planned strategic accessible greenspace for the IPA. These projects are aimed at reducing the pressure on the relevant estuaries by providing spaces for recreational use.
|
Borough/ District |
Name of Site |
Size |
Type of greenspace |
Ecological value/ Sensitivities |
|
Ipswich/ Suffolk Coastal |
Orwell Country Park |
Extension of 25 ha |
Variety of habitats such as woodlands and grasslands |
Adjacent to Stour and Orwell Estuaries Special Protection Area (SPA). Potential issues of recreational pressure (e.g. dogs off leads) on internationally important assemblages of wintering and breeding birds. |
|
Ipswich |
Ipswich Garden Suburb Country Park |
Minimum 24.5ha |
Planned provision of Country Park as part of Ipswich Garden Suburb development, plus a further 40ha of public open space |
No designations. The Country Park is required as part of the mitigation of potential impacts of increased recreational pressure on the Stour and Orwell Estuaries SPA resulting from housing growth. It is therefore anticipated that it will have a positive effect upon the SPA. |
|
Suffolk Coastal |
Adastral Park Open Space |
36ha |
Total open space of 54ha, incorporating 36ha of high quality provision providing a similar role to a Country Park |
Close to Deben Estuary SPA. The open space is provided as part of mitigation against potential impacts of increased recreational pressure on the Deben Estuary SPA resulting from housing growth. |
Table 29: Planned Strategic Accessible Natural Greenspace in the IPA (Haven Gateway Green Infrastructure Strategy for the IPA. 2015)[74]
5.80 The 2008 Study was updated in 2015 to provide an audit of progress and update the position on accessible natural greenspace.[75]
Sites of Special Scientific Interest
5.81 There are a large number of Sites of Special Scientific Interest (SSSI) within the Ipswich Housing Market Area, with 45 SSSIs in Suffolk Coastal 7 in Babergh, 22 in Mid Suffolk and 4 in Ipswich.
5.82 Figure 34 displays the SSSIs, National Nature Reserves (NNR), and Local Nature Reserves (LNR) located in Suffolk. Within Suffolk there are 149 SSSIs which cover 8% of the county, this equates to 31,326ha. The most important SSSIs are nationally designated and become NNRs. SSSIs and NNRs are designated by Natural England. LNRs are places that are of local interest and represent important wildlife or geological features. There are 36 LNR within Suffolk covering an area of 462ha.

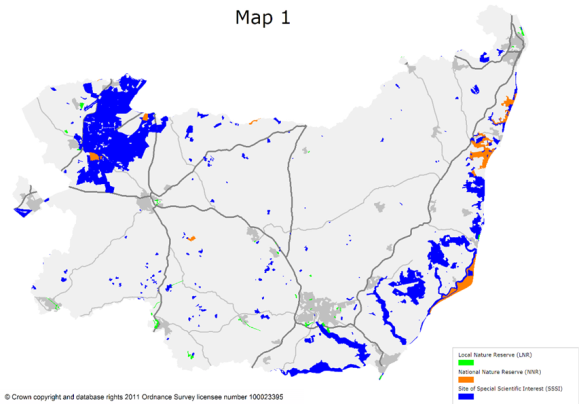
Figure 34: Shows SSSIs, National Nature Reserves, and Local Nature Reserves
5.83 There are four areas of SSSI within Ipswich Borough, three designated for wildlife and one for geology (two areas form part of the same SSSI, the Orwell Estuary). They are located to the south and east of the Borough and one, the Orwell Estuary, also benefits from international habitat protection as a Ramsar Site and Special Protection Area.
5.84 Ipswich contains nine LNRs – The Dales Open Space, Alderman Canal (East and West), Bourne Park Reed Beds, Fishpond Covert, Bixley Heath, Orwell Country Park (Bridge Wood), Pipers Vale and Bobbits Lane. Bixley Heath, Bridge Wood and Bobbits Lane are partly within Suffolk Coastal. Ipswich does not contain any NNRs.
5.85 In addition, the current Ipswich Local Plan proposes three further areas for LNRs which are Brazier's Wood, South of Morland Primary School (which is next to Brazier's Wood) and Pond Hall Farm. The locations of the LNRs are shown on figure 35 below.
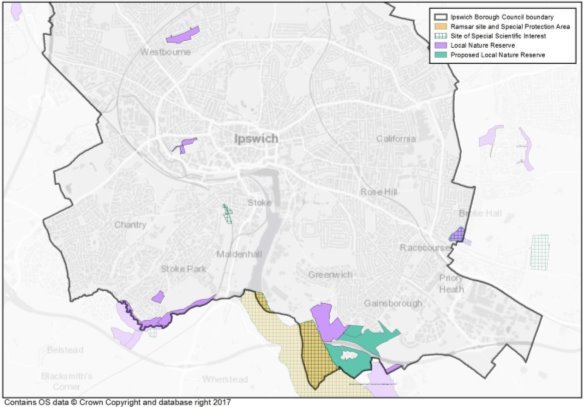
Figure 35: Designated wildlife sites in Ipswich Borough (from Ipswich Borough Council Data)
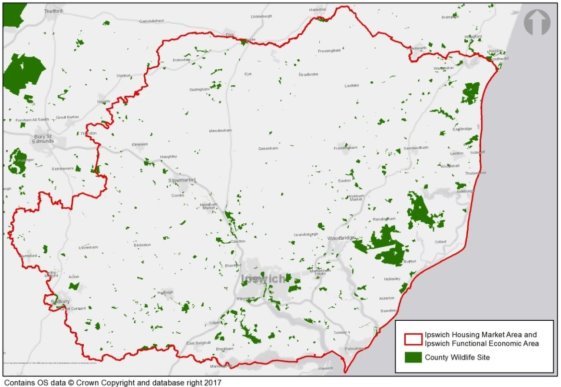
Figure 36: County Wildlife Sites in the IHMA[76]
5.86 Figure 36 shows the spread of County Wildlife Sites (CWS) across the Ipswich Housing Market Area. The non-statutory CWS designation recognises the high value of sites with regard to wildlife and often because they support characteristic or threatened species and or habitats included in local or national Biodiversity Action Plans (BAP). There are 925 CWS in Suffolk covering 5% of the county, which is approximately 19,683ha[77].
5.87 Figure 36 shows Suffolk Coastal has the largest area of CWS throughout the Housing Market Area. Ipswich Borough contains twenty CWSs. All locally-designated wildlife sites across Ipswich were subject to a Phase 1 habitat survey through the Ipswich Wildlife Audit undertaken in 2012-13.[78] Ipswich Borough Authority Monitoring Reports show that, since 2011, the area of protected CWS within the Borough has increased by 44ha.
European Designations
5.88 Figure 37 overleaf displays the Special Areas of Conservation (SAC), Special Protection Areas (SPA), and RAMSAR sites throughout Suffolk. SACs and SPAs are designated through European legislation. RAMSAR sites are designated internationally under the Ramsar Convention 1971. It is clear from the map below that Suffolk Coastal contains a large area of these important designations. It is also apparent that the inland districts of Babergh and Mid Suffolk have far smaller areas of these designations than Suffolk Coastal.

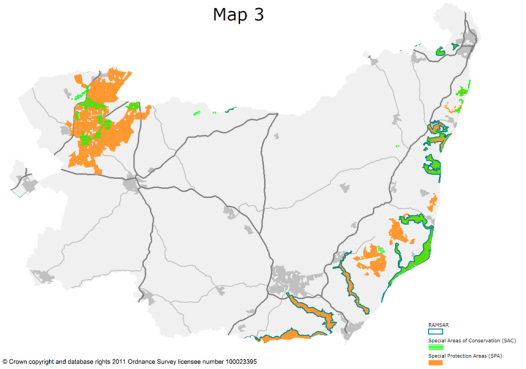
Figure 37: SPA, SAC, RAMSAR (Suffolk Biodiversity Information Service. 2017)[79]
5.89 Special Protection Areas cover over 7% of Suffolk,
27,404ha. Special Areas of Conservation cover 6,385ha,
approximately 1% of the county. RAMSAR sites are
International designations that recognise significant
wetland habitats. There are 6 RAMSAR sites within Suffolk,
one in Ipswich and Suffolk Coastal and a further three
within Suffolk Coastal[80]:
- Alde-Ore Estuary
- Deben Estuary
- Minsmere-Walberswick
- Stour and Orwell Estuaries (partly located in Ipswich Borough)
Green infrastructure and urban biodiversity
5.90 Ipswich is a largely urban area, but it contains green infrastructure, which is defined as "green" assets in an authority area, including parks, river corridors, street trees, managed and unmanaged sites and designed and planted open spaces. This green infrastructure contains a wealth of species and habitat as detailed in the Ipswich Wildlife Audit.[81]
5.91 Ipswich also contains previously developed land, which can be rich in invertebrates and birds, and support some uncommon and rare species of plants. Despite being heavily modified in the past, it is often more or less unmanaged allowing wildlife to thrive. Open Mosaic Habitats on Previously Developed Land are a UK Biodiversity Action Plan Habitat. [82]
Ecosystem services
5.92 Ecosystem services are defined as;
- 'The benefits people obtain from ecosystems. These
include provisioning services such as food and water;
regulating services such as flood and disease control;
cultural services such as spiritual, recreational, and
cultural benefits; and supporting services such as nutrient
cycling that maintain the conditions for life on
Earth.'[83]
- Within IHMA, this could encompass agricultural products, timber, drinking water, energy resources, flood regulation, carbon storage in soils and plants, regulating soil nutrients and ameliorating pollution, providing opportunities for recreation and positive health outcomes and pollination
Future Considerations
- Threat to existing biodiversity designations
- Opportunities for recreation
- Biodiversity net gain
Likely evolution of the baseline without the Local Plan
- Current planning policy requires the inclusion of biodiversity measures in new developments supports Greenways, Local Nature Reserves and site management plans and commits the Council to identifying an ecological network across Ipswich.
- Ipswich's Local Plan sets a target to increase canopy cover to 22% by 2050
- Threat to existing biodiversity designations
Key data sources
- Suffolk Biodiversity information Service.
- Haven Gateway Green Infrastructure Strategy.
- RAMS (SPD)
- Ecological reports, EIAs and AA's (from planning applications, plans etc)
- SBIS
- Wild Ipswich
- Ipswich Wildlife Audit 2012-13 for Phase 1 Habitat Survey data
- AONB
- Analysis of Accessible Natural Greenspace Provision for Suffolk ( Natural England 2010)
Key Issues for the Sustainability Appraisal
|
|
Key SA issue across Ipswich and Suffolk Coastal |
Ipswich Specific Issues |
|
Biodiversity |
The need to conserve and enhance biodiversity (including sites designated for the their nature conservation value) |
Numerous protected species, habitats and sites across the borough and pressures on climate biodiversity arising from climate change and urban development. Need to extend and enhance the green infrastructure network across the whole IHMA. |
|
The need to halt biodiversity net loss |
High biodiversity value. |
Table 30: Key Issues - Biodiversity
Cultural Heritage
Legal Framework
5.93 Local authorities have a statutory duty to protect the setting and integrity of important heritage assets. This includes: Conservation Areas; listed buildings; locally listed buildings (buildings that are considered of important townscape value in the local context rather than the national one); archaeology; scheduled ancient monuments and historic parkland.
5.94 Locally listed buildings of townscape value are important as not all buildings that are of national interest are listed, rather listed buildings are in the main examples of buildings or built forms that are: of nationally importance because they are representative of a typical design period/historic event; or are associated with a particular architect or designer; or contain good examples of particular features or interiors; or are connected with a historic figure such as Cromwell.
5.95 Heritage assets can be extensive and include many heritage assets and their nested and overlapping settings, as well as having a setting of their own. A conservation area will include the settings of listed buildings and have its own setting.
5.96 In contrast Conservation Areas are locally designated based on the particular character and local distinctiveness of an area. The National Planning Policy Framework (NPPF) requires appropriate conservation and enhancement of heritage assets according to the level of significance that they represent. The NPPF also provides the context for considering change in relation to heritage assets and their setting.
5.97 The NPPF is also supported by national planning practice guidance (PPG's) and Good Practice Advice (GPA) Notes produced by Historic England in conjunction with the Historic Environment Forum.
5.98 The character of a historic place is the sum of all its attributes, which may include: its relationships with people, now and through time; its visual aspects; and the features, materials, and spaces associated with its history, including its original configuration and subsequent losses and changes. Heritage assets and their settings contribute to character but it is a broader concept, often used in relation to entire historic areas and landscapes.
5.99 The preservation of Scheduled Monuments often requires little or no direct intervention, but on occasion this is necessary and / or desirable. To help protect them from uncontrolled change or unauthorised geophysical surveys, the 1979 Act introduced two dedicated consent regimes: Scheduled Monument Consent (SMC) and Section 42 licences. In determining if requests for SMC should be granted (conditionally or unconditionally) or refused the Secretary of State gives great weight to the conservation of Scheduled Monuments.
Ipswich's Historic Heritage
5.100 Ipswich has a long and rich heritage as a port engaged in international trade, and the Anglo-Saxon archaeology of the town particularly is recognised as being of European significance: Ipswich was one of only four Middle Saxon 'wic' or 'emporia' sites in England (8th-9th centuries AD), the others being London, Southampton and York . These sites displayed urban characteristics in the AD 700s and were trading with continental Europe. Waterlogged remains along the river front, including wooden structures, contribute to the town's rich and complex archaeological record which spreads across most of the historic core of the town today. The settlement of Ipswich has developed through Saxon, Medieval and later periods, leaving a legacy of history above and below ground which tells the complex story of the town's evolution. The Borough includes parts of the wider landscape of the Gipping Valley and Orwell Estuary, and there are Prehistoric, Roman, Anglo-Saxon and other period archaeological sites within its boundaries.
5.101 Archaeological remains at several sites in Ipswich are protected through designation as Scheduled Monuments, and, in the context of development, remains on all development sites are managed through the implementation of the National Planning Policy Framework (NPPF) and Local Plan policies.
Historic Assets in Ipswich Borough
Archaeology
5.102 The areas of archaeological importance and Scheduled Ancient Monuments in Ipswich are presented on figure 38 overleaf. This is an area of international level importance. An Urban Archaeological Database as part of the Historic Environment Record is being prepared, funded by Historic England, Suffolk County Council Archaeological Service (in collaboration with Ipswich Borough Council). It is creating a map-linked, publicly accessible Urban Archaeological Database (UAD) for Ipswich. The project is mapping all investigative events (excavations, surveys, etc.) in the town looking for archaeology. It will cover the whole of the Ipswich Borough area and include the prehistoric, Roman and earlier Anglo-Saxon remains, relating to the contexts in which Ipswich developed, as well as the medieval suburban area and archaeology of the later expansion of the town. This work will inform supplementary planning guidance on 'Development and Archaeology' the purpose of which is to provide guidance that will help to promote early consideration of archaeological remains across different sites, facilitate understanding of different risks, encourage dialogue on options and approaches, and promote heritage as part of sustainable development.
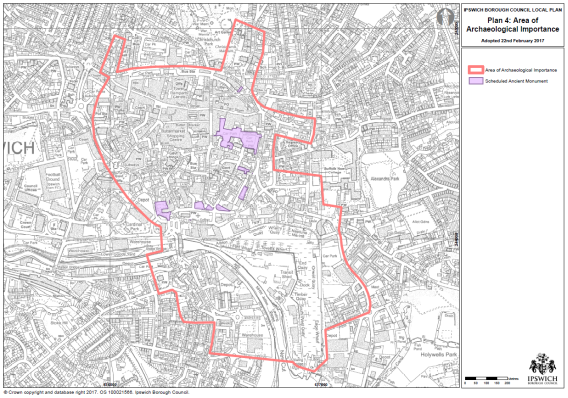
Figure 38: Area of archaeological importance
Conservation Areas
5.103 There are 15 designated conservation areas in the Borough which are shown on figure 39 overleaf. These also heavily overlap with the historic parkland and Area of Archaeological Importance.
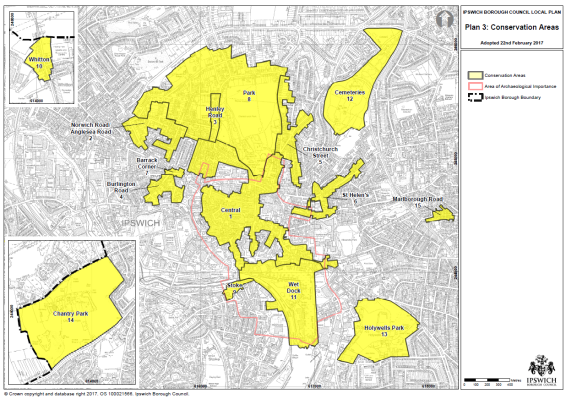
Figure 39: Conservation areas within the Ipswich Boundary
Listed Buildings
5.104 Buildings listed for their special architectural or historic interest have statutory protection under the Planning (Listed Buildings and Conservation Areas) Act 1990. The Council has a statutory duty to preserve and enhance the character and appearance of listed buildings in Ipswich and will therefore only grant planning permission and listed building consent for works and changes of use which complement this obligation. There are currently 650 listed buildings in Ipswich which is a comparatively large number for a defined urban town.
Historic Parkland/Scheduled Ancient Monuments
5.105 Suffolk Coastal District contains the largest number of Scheduled Monuments,
Conservation Areas and Registered Parks & Gardens when compared to the other local authorities. In Ipswich there is a legacy from large stately homes set in existing parkland. For example, Christchurch Mansion which is a Grade II historic park and garden; Chantry Park – Grade II historic park and garden and has been a public park since 1928; and Holywells Park. These also include listed buildings and structures. The Old & New Cemetery are also Grade II* historic park and garden.
Ipswich Buildings at Risk Register
5.106 There are currently 63 heritage assets within Suffolk that are listed on the Heritage at Risk Register, 6 in Ipswich, which are;
- 1-5 College Street (Grade II) – vacant since 1993 and subject to vandalism. damaged by fire in 2002;
- 4 College Street (Grade II) – Vacant since 1981 and damaged by fire in 1992;
- St Michael's Church, Upper Orwell Street (Grade II) - Roof of church destroyed by fire in March 2011;
- County Hall, St Helen's Street (Grade II) - vacant since 2003-4, the site has suffered sustained vandalism but has been made secure in 2011 ;
- The Old Bell Inn, Stoke Street (Grade II) - vacant site and poor condition; and
- The Tolly Brewery (Grade II) - vacant site. The building has suffered from sustained vandalism and theft that has seen the systematic removal of all the brewing equipment
5.107 In Ipswich, in 1987, 44 buildings out of 550 listed buildings were considered to be at risk. In 2012, the total has reduced to six buildings out of 650 listed buildings. This has been achieved by a combination of persuasion and small amounts of grant aid to owners or, in the last resort, the threat of the use of our statutory powers.
5.108 Not all buildings are straightforward to repair or convert to a new use. However, recent examples of buildings successfully removed from the Register include 13 Museum Street. Built in 1847 as the Ipswich Museum and subsequently used as a dance school, this fine building was vacant for over 20 years before being converted into a restaurant in 2008.
5.109 Ipswich Building Preservation Trust was established in 1977 by the Council to act as a 'repairer of last resort', assisting the Council in dealing with the dilapidated buildings in Ipswich that might otherwise not be repaired. The Council and the Trust work closely on buildings at risk issues.
Locally listed heritage assets
5.110 Ipswich Borough Council adopted a Local List (Buildings of Townscape Interest) Supplementary Planning Document (SPD) in 2013. Following a review, revisions to the Local List were adopted on 27th July 2016. The revisions add eight properties to the list and revise the entries for two buildings currently on the list at 220 Rushmere Road and 224-226 Rushmere Road. The Local List includes a wide range of buildings and structures that together make a major contribution to the character and distinctiveness of the area. The original SPD contained 149 entries of buildings, groups of buildings or structures. With the 2016 revisions this means that currently there are 157 locally listed buildings in Ipswich Borough.
5.111 The Ipswich Society initially identified locally important buildings in 1984. It is envisaged that local history groups, local residents and members of the public will nominate buildings and structures that meet the criteria for inclusion on the Local List. Owners are notified if and when their building has been added to the Local List with an explanation of what this means and how it affects them. The Borough Council reviews the list annually.
5.112 The inclusion of a building or structure on the list will be a material consideration which the Council will take into account when considering planning applications. This means that when a planning application is made for a property on the Local List then any proposed alterations or extensions will be looked at in the light of the character of that property. Planning permission or other relevant consents will not normally be granted for the demolition of a building on the List of Locally Important Buildings.
Open Spaces
5.113 Access to high quality open spaces and sport and recreation facilities and public open space provision is important for the health and wellbeing of individuals and communities. Ipswich contains over 518 hectares of open spaces, sport and recreation facilities, a scale normally associated with much larger towns and cities Public open space provision also has a key role through the creation of wildlife habitat and linking existing habitats through the creation of wildlife corridors as well as providing key climate change mitigation to help the Borough improve climate change and resilience. It is the complexity and interlinkages between these functions and the contribution public open space makes to achieving these aims that makes its provision such an important part of the planning function.
5.114 Urban parks and formal gardens including historic parks and gardens and gardens (registered landscapes) for informal recreation and community events. This type of open space often has a variety of functions and provides a wide range of benefits.. Examples in Ipswich include Christchurch Park – a historic park and garden associated with Christchurch Mansion which is a Grade II historic park and garden; Chantry Park – Grade II historic park and garden and has been a public park since 1928; and Holywells Park. The historic parks named above include listed buildings and structures.
5.115 Chantry Park, which is the largest park in Ipswich at 127-acres, lies to the west of the town centre. The park provides a similar multi-functional site to Christchurch Park in that it is home to two children's play areas, a bowling green, the Ipswich and East Suffolk Cricket Club, and a 5km parkrun. It is also home to ActivLives 'Chantry Walled Garden' project and host events such as music, arts and crafts and nature walks. The park is home to Chantry Mansion, which dates from the 18th Century.
Holywells Park lies to the south east of the town centre. This 67-acre park includes a seasonal water play facility, a bowling green and a children's play area.
Attractions
5.116 Ipswich has a number of visitor attractions which include the following;
- Ipswich Museum -a free attraction depicting the culture, history and natural heritage of Ipswich and Suffolk. It is operated by Colchester and Ipswich Museums;
- Christchurch Mansion - a free attraction located in Christchurch Park: a 16th Century house that was constructed by Edmund Withypoll, the son of a successful London merchant;
- Ipswich Transport Museum - reputedly the largest collection of transport items in Britain devoted to just one town with all items on display either made or used in and around Ipswich. The operations of the Museum are supported by the Friends of the Ipswich Transport Museum and charges an entrance fee;
- Orwell River Cruises - offer regular, scheduled cruises along the River Orwell to Harwich from the Old Custom's House in Ipswich Dock. The vessel can host 118 people. It can be hired for events and also offers day trips;
- Victor Cruises offers a range of cruises departing from the Old Custom's House in Ipswich Dock. In the summer, it operates a regular scheduled service
5.117 In addition to these formal attractions, guided walks around Ipswich operate between May and September, with the walks taking place on Tuesdays and Thursdays, and occasionally on Saturdays and Wednesday evenings. The walks include a series of standard walks (Waterfront via Fore Street, Waterfront via St Peter's Street, Town Centre, Westgate and Northgate) and themed walks such as Wolsey Makes His Mark, Charles Dickens in Ipswich, Ipswich Street Names Old & New, Explorers & Adventurers, and Marvels of Medieval Ipswich.
5.118 The marina has occasional visiting boats, including Tall Ships which provide a temporary attraction for the town. Other attractions are the Suffolk Ski Centre – a dry skiing facility, a ten pin bowling alley, a number of nightclubs and a range of activities, events and festivals such as the Pulse Festival , a part curated, part open application 10 day festival focusing on new and innovative approaches to contemporary theatre and performance, IP-Art - the annual Ipswich Arts Festival which takes place between June and July which showcases a range of different arts performances covering dance, film, comedy, theatre, literature, and music and the Ipswich Jazz Festival.
5.119 The role of Ipswich Museum is set to change in the future through the £23 million Ipswich Arts & Museum Project (I-AM). This project is aiming to transform the Museum into a more prominent visitor attraction focused on Ipswich's culture, heritage, science and the arts. The attraction will include space for visual and performing arts, new displays, a café and a shop. The project is set to be completed by 2019 and will help establish a 'cultural arc' stretching from High Street, to the Waterfront and on to the New Wolsey Theatre.
5.120 The ratings provided on TripAdvisor suggest that the key assets and attractions of Ipswich are delivering good quality experiences. Christchurch Mansion (4.5 rating), Ipswich Transport Museum (4.5), and Ipswich Museum (4.5) each achieve good reviews as attractions.
5.121 The table below shows the popularity of the top attractions in and around the Ipswich Borough. The Portman Road stadium figures are based on an average attendance of 17,000 per home game. Clearly there is scope to improve visitor numbers in Ipswich.
|
Attraction/Venue |
No. of visits (2014) |
|
Ipswich Museums1 |
117,500 |
|
Portman Road/Ipswich Town Football Club2 |
391,000 |
|
Jimmy's Farm |
500,000 |
|
Orwell Lady |
8,055 |
Table 31: Popular top attractions
Theatres
5.122 'DanceEast' is based at the Jerwood DanceHouse in Ipswich. It was founded in 1983 gaining National Dance Agency status in 1994. As well as being a dance class facilitator and theatre venue, it regularly puts on events. In 2014 it recruited a new cohort of Associate Artists and have spent the last two years working with some of the most exciting and talented dance artists in the UK. The Jerwood Dancehouse on Ipswich's Waterfront hosts over 50 dance classes and courses in its specially designed dance studios. There is also a 200-capacity theatre that hosts a variety of performances. In 2015, this will include Murmur & Inked, Bleak House, Encore Dance Company, 4X4 and FRAME[D]
5.123 Ipswich Regent Theatre is a 1500+ capacity venue that hosts a variety of mainstream and niche shows and performances. In 2015, feature acts include Katherine Jenkins, the Full Monty Stage Show, Michael Ball, Dara O Briain, Simple Minds, Lulu, Michael McIntyre, Jimmy Carr, Alan Carr and Kevin Bridges. Jurassic Adventures, Abba Mania, Ministry of Science Live, Summer Musical Theatre Workshop provide examples of some other themed performances held at the Regent. The venue also hosts the annual Pantomime, which for 2015 was Aladdin.
5.124 Ipswich Corn Exchange is an 800+ capacity venue which specialises in alternative and niche interest acts and performances. These include Roy Orbison and Friends, The Simon & Garfunkel Story, Jaleo Flamenco UK tour, and Rollermania.
5.125 New Wolsey Theatre specialises in creating and producing a dynamic programme of theatre and other live performances and projects. Performances at the time of writing include A Horrible History Of Ipswich, The Mist In The Mirror, The Tim Kliphuis Trio, The History Boys, Blood Wedding, Duke's Comedy Club - Spring 2015, and The Business Of Murder. I t also has a studio for smaller performances and workshops.
5.126 Ipswich Film Theatre is a two-screen cinema specialising in independent and world cinema.
5.127 The Red Rose Chain is an independent Theatre Company that create original productions which confront social concerns, often working with hard-to-reach groups. They have been awarded a large number of awards including 'Not for Profit Business of the Year' (Anglian Business Awards, 2009 & 2011). The company performs at the Avenue, near to the train station.It is currently ranked 17 on TripAdvisor among 116 attractions in Ipswich (2017).
5.128 John Mills Theatre – home to the Eastern Angles, a touring theatre company that presents various plays throughout the year across East Anglia. The Sir John Mills theatre is used for a 'comic extravaganza' around Christmas and can be hired by other performing groups at other times of the year. It is currently ranked No.28 on TripAdvisor among 116 attractions in Ipswich (2017).
5.129 TripAdvisor ratings for the principal arts venues of the New Wolsey (5 rating), DanceEast (4.5), Regent Theatre (4), Corn Exchange (4) are high. The theatre venues have a significant role in attracting day visitors, however only the Regent Theatre at present is able to encourage a significant volume of overnight stays.[84]
Future Considerations
- How to ensure the volume of overnight stays increases
- Ensuring the rich and varied cultural heritage is benefitted and enhanced given Arts funding changes moving from London centred to the regions
- Bringing heritage assets back into optimum use from being buildings at risk and ensuring other heritage assets do not become buildings at risk
Likely evolution of the baseline without the Local Plan
- Most designated heritage assets would be protected without the Local Plan (since works to them invariably require consent)
- Inappropriate development may harm the setting of such assets
Key data sources
- Suffolk County Council archaeology
- 2017 WYG Retail and Leisure Study
- AECOM Ipswich Visitor Destination Plan Baseline (April 2015)
- Historic Buildings at Risk Register
- Heritage England GPA
- DCMS - Scheduled Monuments & nationally important but non-scheduled monuments (Oct 2013)
- Local List (Buildings of Townscape Interest) Supplementary Planning Document (2013)
- Local List (Buildings of Townscape Interest) Supplementary Planning Document, 2016 update
Key Issues for the Sustainability Appraisal
|
|
Key SA issue across Ipswich and Suffolk Coastal |
Ipswich Specific Issues |
|
Cultural Heritage |
Maintaining and enhancing designated and non-designated heritage and cultural assets |
High number of heritage assets. |
Table 32: Key Issues – Cultural Heritage
Landscape
5.130 Ipswich is a high density urban centre whereas Suffolk Coastal, Mid Suffolk and Babergh are formed of market towns and villages separated by rural countryside. Ipswich, as an entirely urban area, is different in character from the surrounding districts which all have a large rural population. Suffolk Coastal has the lowest number of people living in the country but Babergh, Mid Suffolk and Suffolk Coastal districts all have a much higher proportion of rural dwellers than the average for England and Wales.
|
Location |
% of population living within a rural setting |
|
Suffolk Coastal |
45 |
|
Mid Suffolk |
75 |
|
Ipswich |
0 |
|
Suffolk |
40 |
|
England and Wales |
20 |
Table 33: Percentage of Population Living within a Rural Setting[85]
5.131 According to the ONS 2015 mid-year population estimate, Ipswich has a total population of 135,600. The Borough is defined as a tightly bounded built up area. The wider Ipswich 'urban area' extends beyond the Borough although much of the boundary to the Borough is framed by sensitive rural landscape which often has biodiversity and habitat protected status as discussed earlier. In addition, there are some pockets of developed land lying on the edge of the built up area of Ipswich and the wider 'urban area', on which often urban fringe type activities take place such as utility infrastructure and scrapyards.
Historic parks and gardens
5.132 Within the IHMA there are 17 historic parks and gardens. These are split between the districts as follows;
- Suffolk Coastal: 7
- Babergh: 5
- Mid Suffolk: 2
- Ipswich: 3
5.133 These parks and gardens are designated heritage assets, and as such are to be protected appropriately. Drawing attention to these sites will increase awareness of the value they have to our natural environment and encourage people to treat these places with the care they deserve. Suffolk Coastal has the most historic parks and gardens of the IHMA; this demonstrates the district's importance in terms of cultural heritage and historically important landscapes.[86]
Area of Outstanding Natural Beauty (AONB)
5.134 The Suffolk Coast and Heaths Area of Outstanding Natural Beauty, the Special Landscape Areas, and the Heritage Coast are detailed in the below graphic, and cover the district of Suffolk Coastal. The AONB comprises shingle beaches, heathland, forest, estuaries, and iconic coastal towns. It covers approximately 403 square kilometres that stretch 60 kilometres along the Suffolk coast, from the Stour in the South to Kessingland in the North.
5.135 The special landscape areas shown in figure 40 represent non-statutory conservation areas which are, legally or as a matter of policy, protected from development. The Heritage Coast has been defined by SCDC and Natural England with the intention of protecting, conserving and enhancing the stretch of coast from Felixstowe to Walberswick.
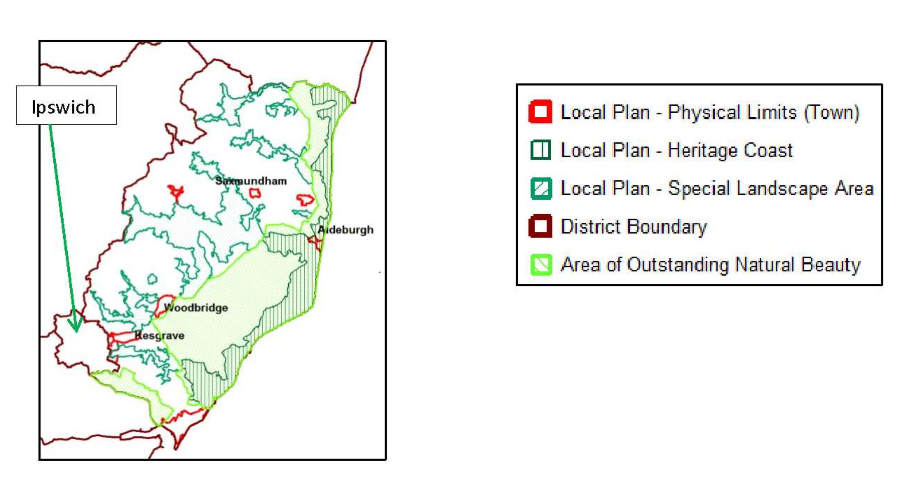
Ipswich
© Crown Copyright and database rights 2012 Ordnance Survey 100019684
Figure 40: Heritage Coast, AONB and SLA boundary(GGP. 2017)
National Character Areas
Suffolk Landscape Character Assessment
5.136 Suffolk County Council has undertaken a project to describe landscapes in detail, throughout Suffolk and assess what particular character and qualities make up the different landscape areas of the county. This was conducted in association with the district councils. The project is using Countryside Agency guidelines and methodology developed by the Living Landscapes Project. This has maintained a consistent approach across Suffolk. The work was prepared in 2008 and then updated in 2011.
Landscape Typology
5.137 In urban design terms, Ipswich would be described as 'hard urban'. Typical as settlements develop, there is a tight dense urban core which becomes less dense further away from the centre and lower density bigger homes tend to be located in the outskirts to the point where urban meets rural. In terms of typology of landscape, Ipswich Borough and the wider Ipswich urban area which takes in land located in Babergh, Mid Suffolk and Suffolk Coastal Districts is identified as 'urban'. This land is shown as grey on the plan overleaf. Much of the surrounding land is formed of different farmland types. To the west, the yellow land is defined as 'Rolling Valley Farmlands'. Immediately adjoining to the south west is a light khaki colour which is 'Rolling Estate Chalklands' with 'Rolling Estate Farmland' lying behind (which is the mid khaki colour). To the east are 'Estate sandlands' (shown pink) which is interspersed with 'Rolling Estate Farmland' which also lies to the north east of Ipswich, with some 'Valley Meadow' (shown as turquoise blue) following the line of the rivers with the exception of the River Orwell to the south which is lined by 'salt marsh and intertidal flats'.
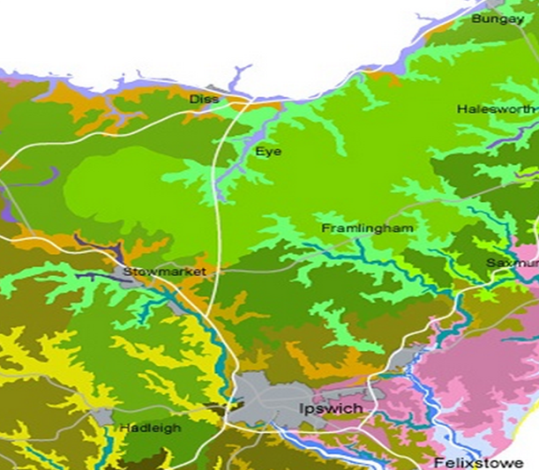
Figure 41: Extract from the SCC Landscape Character Assessment Map
5.138 Clearly there is a variety of landscape types that surround the built up area of Ipswich. Some of these landscapes are in excellent condition; however, many are affected by intakes into arable production, by horse grazing and by under-grazing. The sense of tranquillity and isolation of this landscape can also be intruded upon by the development of the adjacent rolling valley landscapes, which are often a focus for settlement and development.
Studies to improve local landscape character assessment
5.139 Ipswich Borough Council is working on providing a set of urban character assessments which include an element of landscape assessments and identify important vistas, setting and habitat looking both out and into Ipswich from an urban design viewpoint. This will inform the sustainability appraisal.
5.140 In addition, there is a landscape sensitivity analysis which is being commissioned by all the authorities in the Ipswich Housing Management Area which will help to provide evidence for the sensitive location of development on the fringes of Ipswich.
Future Considerations
- Proposed Landscape Character Assessment and Settlement Fringe Sensitivity Analysis
- Pressure from development on the AONB
- Urban Character SPD's will be completed
Likely evolution of the baseline without the Local Plan
- Inappropriately located development within the general landscape
- Pressure from development on more sensitive landscape areas such as the ANOB
Key data sources
- The Council's GIS system.
- Suffolk Landscape Character Assessment 2008 and 2011 update
- Urban Character SPDs
Key Issues for the Sustainability Appraisal
|
|
Key SA issue across Ipswich and Suffolk Coastal |
Ipswich Specific Issues |
|
Landscape |
The need to ensure the protection and enhancement of local distinctiveness and character |
Managing development while protecting significant areas of environmental protection. Delivering high quality design that respects local character. |
|
The need to manage pressure from new development on the AONB |
Some AONB areas in Ipswich. |
Table 34: Key Issues – Landscape
[48] Data from Ordnance Survey
[49] In order to comply with the Floods and Water Management Act 2010 and the Flood Risk Regulations 2009.
[50] The water body status objectives and wider objectives of the European Water Framework Directive, transposed into UK law as the Water Environment (Water Framework Directive) (England and Wales) Regulations 2003.
[52] Ipswich Borough Council
[53] This includes projects such as the CATCH project, and monitoring undertaken in relation to planning applications or major scheme proposals such as the Upper Orwell Crossings.
[58] IBC Contaminated Land Strategy 2013-18, para. 1.4
[60] IBC 2016-2017 Business Plan Culture and Environment (July 2017)
[66] Environment Agency and Ipswich Borough Council
[68] https://www.gov.uk/government/publications/sanitation-hot-water-safety-and-water-efficiency-approved-document-g
[75] https://www.ipswich.gov.uk/sites/default/files/ipa_green_infrastructure_report_-_final_published_october_2015.pdf.
[81]https://www.ipswich.gov.uk/sites/default/files/adopted_site_allocations_and_policies_dpd_and_appendix_3a_site_sheets.pdf)
[84] AECOM Ipswich Visitor Destination Plan Baseline (April 2015)