Sustainability Appraisal Scoping Report
Chapter 6 Economic baseline (Task 2)
Economy
Economic / Business counts
6.1 Table 35 shows data for the size of UK businesses across the Ipswich Housing Market Area and the East of England. The rural districts of Suffolk Coastal, Babergh, and Mid Suffolk follow the trends of the east of England, whereas Ipswich businesses follow a different pattern , largely because it is an urban area.
6.2 The most notable difference between the data for Ipswich and the rural districts is the percentage of 'local units' that are micro (78%), small (17.2%), medium (4.2%), and large (0.6%) sizes. Ipswich has a much higher proportion of small and medium and large businesses than the average for the East of England. Larger settlements in the county like Ipswich, attract most of the larger businesses and other related supporting businesses, and also have larger sustainably located land that can be developed for the larger businesses.
|
|
Suffolk Coastal (%) |
Babergh (%) |
Mid Suffolk (%) |
Ipswich (%) |
East of England (%) |
|
Enterprises |
|
|
|
|
|
|
Micro (0-9) |
88.7 |
89.8 |
90.2 |
86.0 |
89.7 |
|
Small (10-49) |
9.8 |
8.5 |
8.3 |
11.0 |
8.5 |
|
Medium (50-249) |
1.2 |
1.5 |
1.3 |
2.3 |
1.5 |
|
Large (250+) |
0.3 |
0.2 |
0.3 |
0.8 |
0.4 |
|
Local Units |
|
|
|
|
|
|
Micro (0-9) |
84.7 |
85.7 |
86.9 |
78.0 |
85.1 |
|
Small (10-49) |
13.0 |
12.3 |
11.0 |
17.2 |
12.1 |
|
Medium (50-249) |
2.1 |
1.8 |
1.9 |
4.2 |
2.5 |
|
Large (250+) |
0.2 |
0.2 |
0.3 |
0.6 |
0.3 |
Table 35: UK Business Counts (NOMIS. 2016)[87]
Business age
6.3 Figure 43 overleaf displays the number of businesses in each age range for the authorities which make up the Ipswich Housing Market Area. The trend towards a higher number of older, more established businesses is in line with that of the East of England and England. However, in Ipswich, although the majority of the businesses are well established , Ipswich has the lowest number of businesses that are more than 4 years old, (890 are to 9 years old and 1,380 are 10 or more years old), respectively in comparison with its more rural neighbours. This implies that Ipswich has a higher business turnover in Ipswich than in the other districts in The Ipswich Housing Market Area.
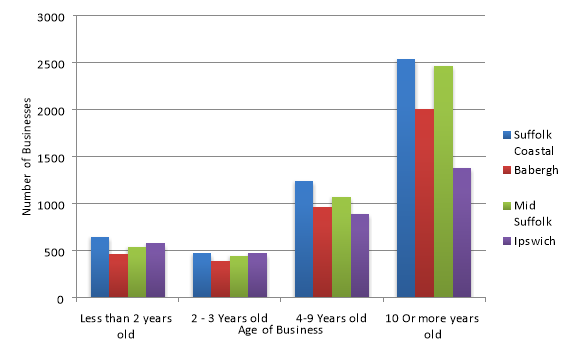
Figure 42: Business Age, 2013 (NESS, 2013)[88]
6.4 Figure 43 overleaf shows the number of active businesses across the Ipswich Housing Market Area from 2004 through to 2015. Suffolk Coastal has a noticeably higher number of active businesses than Babergh, Mid Suffolk, and Ipswich between 2004 and 2015.
6.5 The data shows a consistent trend across all the authorities. This being the drop in active number of businesses from approximately 2008 through to 2013, which is a likely consequence of the 2007/08 global recession. However, after the recession there is a noticeable pickup in the data which demonstrates the promising signs of business growth although this is less notable in Babergh and Mid Suffolk which remains relatively static.
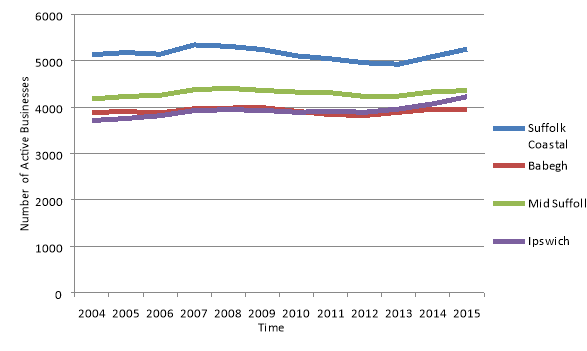 Figure 43: Number of active businesses (Suffolk
Observatory)[89]
Figure 43: Number of active businesses (Suffolk
Observatory)[89]
Business Formation Rates from 2011 to 2014
6.6 Table 36 below displays the business formation rates from 2011 to 2014. Of all the districts in the Ipswich Housing Market Area, Ipswich has been consistently better at forming new businesses than the Suffolk average and the differential is increasing. In common with the other districts in the Ipswich Housing Market Area and Suffolk there has been a slight dip in the formation of new businesses between 2013 and 2014.
|
|
Business Formation Rate 2011 (%) |
Business Formation Rate 2012 (%) |
Business Formation Rate 2013 (%) |
Business Formation Rate 2014 (%) |
|
Suffolk Coastal |
8.6 |
8.7 |
10.1 |
11 |
|
Babergh |
8.6 |
8.4 |
10.9 |
10.6 |
|
Mid Suffolk |
8.7 |
7.8 |
10.5 |
9.1 |
|
Ipswich |
10.9 |
11.1 |
13.6 |
12.8 |
|
Suffolk |
9.2 |
8.9 |
11.4 |
10.7 |
Table 36: Business formation rates 2011-2014 (Suffolk Observatory. 2014)[90]
Employment
6.7 Measured by the Office for National Statistics (ONS) Business Register and Employment Survey there were 183,000 individual employee jobs in the Ipswich HMA in 2015. This is the highest level recorded in the Ipswich HMA since the collection of this data was begun in2009. Overall the number of employee jobs in the Ipswich HMA has increased by 5.8% between 2009 and 2015. These figures compare to an increase of 7.8% for the region and an increase of 7.1% nationally over the same time period. At the local authority level within the Ipswich HMA, Babergh recorded an increase of 6.9% in employee jobs between 2009 and 2015, compared to an increase of 4.5% in Ipswich, a rise of 6.3% in Mid Suffolk and 6.5% growth in Suffolk Coastal.[91]
6.8 However, in all cases, the rise in the number of new jobs created is lower than both the regional and the national average. Ipswich has had the lowest level of growth, despite having bigger businesses than the rest of the authorities in the IMA.
6.9 Table 37 overleaf portrays the employment and unemployment figures for the different districts that make up the Ipswich Housing Market Area and compares them to the regional and national averages. The data shows a clear divide between the predominately rural districts and the urban borough of Ipswich. This can be seen in the unemployment figure; the rural districts all have a lower unemployment percentage than the regional (3.7%) and national averages (5.1%). However, Ipswich (4.7%) has an unemployment figure that is higher than the regional figure but just under the national average.
6.10 Another figure that indicates the economic divide between the rural districts and Ipswich is the self-employed figure. Suffolk Coastal (14.6%), Babergh (13.8%), and Mid Suffolk (11.5%) all have a higher percentage of the population that are self-employed than the regional (10.7%) and national (10.6%) averages. Whereas the figure for Ipswich (7.7%) is lower than both the regional and national figures. It is important to note that self-employment figures are very changeable and should be understood with that in mind.
6.11 This difference in the predominance of self-employment reflects the geography of the authorities, with national data from the Census indicating that of all residents in work that reside in rural locations, 16.5% are self-employed, whilst of those living in urban areas, 14.4% are self-employed.
6.12 Across the Ipswich Housing Market Area the figures for males 'in employment' across the rural districts are higher than that for Ipswich. This contrasts with the figures for females, which are the opposite. The rural districts have lower female 'in employment' figures than Ipswich. Overall however, because of the lower number of males in employment in Ipswich, overall, people in employment in Ipswich are lower than the more rural districts. This is surprising given the relative youth of the Ipswich population in comparison with the other more rural districts. (see the population review).
6.13 Over the last twelve months, unemployment has increased
across the Ipswich HMA (by 8.6%), which is significantly
higher than the average for England which is only 2%. This
means that there are 4 times as many unemployed in the
Ipswich Housing Market Area as in comparison to the rest of
Great Britain (GB) and a higher number than the average for
the region (5.5%).
6.14 All authorities within the Ipswich HMA have also recorded a rise in unemployment over the last year although the rate of increase is smallest in Ipswich (however it should be remembered that Ipswich had the highest rate of unemployment in the HMA).Unemployment has increased by 20.8% in Babergh, by 1.4% in Ipswich, by 10.9% in Mid Suffolk and by 27.8% in Suffolk Coastal. It should be noted however that the unemployment level in all locations is markedly lower than the levels recorded in January 2013.
|
|
Suffolk Coastal (%) |
Babergh (%) |
Mid Suffolk (%) |
Ipswich (%) |
East of England (%) |
Great Britain (%) |
|
All People |
|
|
|
|
|
|
|
Economically Active |
80.1 |
76.0 |
76.9 |
78.9 |
80.1 |
78.1 |
|
In employment |
77.2 |
73.4 |
75.0 |
73.8 |
77.1 |
74.0 |
|
Employees |
61.7 |
59.6 |
63.0 |
65.8 |
66.1 |
63.1 |
|
Self employed |
14.6 |
13.8 |
11.5 |
7.7 |
10.7 |
10.6 |
|
Unemployed |
2.7 |
3.2 |
3.2 |
4.7 |
3.7 |
5.1 |
|
Males |
|
|
|
|
|
|
|
Economically Active |
85.2 |
77.6 |
81.9 |
76.2 |
85.8 |
83.5 |
|
In employment |
81.7 |
74.2 |
79.1 |
73.3 |
82.5 |
79.2 |
|
Employees |
65.9 |
57.0 |
62.0 |
63.0 |
68.1 |
64.5 |
|
Self employed |
14.9 |
17.2 |
16.0 |
10.3 |
14.3 |
14.3 |
|
Unemployed |
|
|
|
|
3.7 |
5.1 |
|
Females |
|
|
|
|
|
|
|
Economically Active |
75.2 |
74.4 |
72.0 |
81.6 |
74.6 |
72.7 |
|
In employment |
72.8 |
72.6 |
71.0 |
74.3 |
71.7 |
69.0 |
|
Employees |
57.4 |
62.2 |
63.9 |
68.6 |
64.2 |
61.6 |
|
Self employed |
14.3 |
|
|
|
7.1 |
6.9 |
|
Unemployed |
|
|
|
|
3.8 |
5.1 |
Table 37: Employment and Unemployment July 2015-June 2016 (NOMIS. 2016)[92]
Out-of-work benefit Levels
6.15 Table 38 shows the out-of-work benefits for Ipswich and the neighbouring authorities which make up the Ipswich Policy Area, the East of England and Great Britain. The figures in the table are percentages of the total population of working age (16-64 years).
|
|
Suffolk Coastal (%) |
Babergh (%) |
Mid Suffolk (%) |
Ipswich (%) |
East of England (%) |
Great Britain (%) |
|
Total claimants |
7.7 |
7.7 |
6.7 |
12.7 |
9.3 |
11.5 |
|
JSA |
0.4 |
0.7 |
0.6 |
1.6 |
0.9 |
1.3 |
|
ESA and Incapacity benefits |
4.2 |
4 |
3.4 |
6.7 |
4.8 |
6.2 |
|
Lone parents |
0.6 |
0.7 |
0.5 |
1.2 |
0.9 |
1 |
|
Carers |
1.4 |
1.3 |
1.2 |
1.8 |
1.4 |
1.7 |
|
Others on income related benefits |
0.2 |
0.1 |
0.1 |
0.2 |
0.2 |
0.2 |
|
Disabled |
0.7 |
0.8 |
0.7 |
0.9 |
0.8 |
0.9 |
|
Bereaved |
0.2 |
0.2 |
0.2 |
0.2 |
0.2 |
0.2 |
|
Main out-of-work benefits |
5.3 |
5.4 |
4.6 |
9.8 |
6.9 |
8.7 |
Table 38: Out-of-work benefits 2016 (NOMIS. 2016)[93]
6.16 There is a similarity between the levels of out of work benefits in the rural districts. For Ipswich it is a different picture. Ipswich has the highest levels of claimants across every benefit type in comparison with Babergh , Mid Suffolk and Suffolk Coastal districts as well as in comparison to the average for the East of England and Great Britain.
The pay gap
6.17 The table overleaf shows the pay gap between male and female workers at an hourly rate. Full-time female workers are paid less than male full time workers across the IHMA as well as in comparison to the average for the East of England and the wider Great British economy. On average female full-time workers in Ipswich earn just over 23% less than full-time males in terms of hourly pay so roughly speaking for every £10 a male full- time worker earns hourly in Ipswich, a female worker will only earn £7.70. Both male and female full-time hourly pay is lower than found across the East of England and Great Britain as a whole.
|
Gross Weekly Pay |
Suffolk Coastal (pounds) |
Babergh (pounds) |
Mid Suffolk (pounds) |
Ipswich (pounds) |
East of England (pounds) |
Great Britain (pounds) |
|
Full time workers |
586.30 |
547.10 |
503.50 |
492.70 |
569.40 |
541.0 |
|
Male full-time workers |
625.70 |
630.30 |
532.20 |
544.40 |
613.30 |
581.20 |
|
Female full-time workers |
433.50 |
405.80 |
465.70 |
421.0 |
496.90 |
481.10 |
|
Hourly Pay – Excluding Overtime |
|
|
|
|
|
|
|
Full-time workers |
14.70 |
13.65 |
12.78 |
11.90 |
14.30 |
13.66 |
|
Male full-time workers |
15.46 |
14.50 |
12.90 |
13.07 |
15.00 |
14.25 |
|
Female full-time workers |
11.61 |
10.84 |
11.47 |
10.93 |
13.12 |
12.84 |
Table 39: Earnings by residence (NOMIS. 2016)[94]
Employee Jobs by Industry
6.18 Figure 44, overleaf, depicts the employment groups that people in Ipswich are employed in and compares them to the regional and national trends. Ipswich has a higher than average number of people employed in the service sector than would be expected in comparison to the regional and Great Britain (GB) national average at 21.5% of the labour force compared to 16.2% regionally and 16.8% nationally.
6.19 There is also a lower proportion of professional people
and senior managers and directors in Ipswich (36.1%) than
would be expected in comparison to regional (46%) and GB
national (45.5%) averages. This may be because of the
significantly higher number of larger businesses in Ipswich
in comparison to the rural districts in the Ipswich Housing
Market Area.
6.20 This trend may also be a function of the fact that it is difficult to build speculative modern office development in Ipswich because of the low rents. As a consequence of this and the wider issue of transport connectivity, Ipswich may not be able to attract those organisations who would employ a higher proportion of professional and managerial staff.
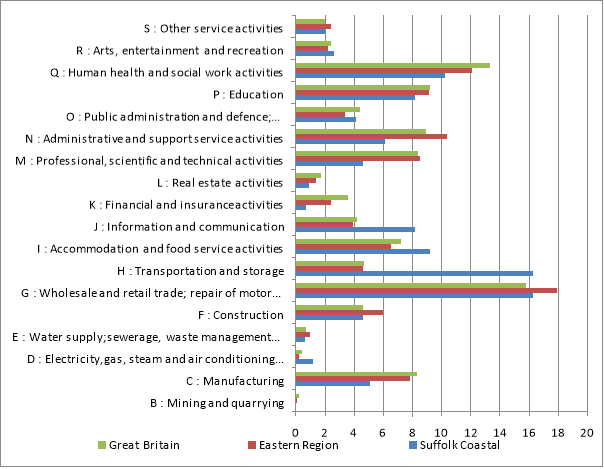
Figure 44: % Employee Jobs by Industry (NOMIS. 2015)[95]
6.21 Significantly there is a higher proportion of the Ipswich workforce employed in the financial and insurance sector (7.2% compared to 2.4% in the East and 3.6% in GB) as well as human health and social work (15.9% compared to 12.1% in the East and 13.3% in GB). Additionally public administration is also higher than would have been expected in Ipswich as a source of employment (6.5% compared to 3.4% in the East and 4.4% in GB). This may be reflective of the fact that Ipswich is the county town. 'Accommodation and food service activities'; 'wholesale and retail trade; repair of motor vehicles and motorcycles'; 'construction'; and 'information and communication' are all industries that are under-represented in Ipswich in comparison to the East and the GB national picture.
Earnings
6.22 Table 40 displays the earnings of full time male and female workers which shows that full time male workers are paid a significant amount more than full time female workers at all geographical levels. Gross weekly pay for male workers in Suffolk Coastal (£625.70) and Babergh (£630.30) is higher than the regional (£613.30) and national averages (£581.20). Whereas the gross weekly pay for female workers is lower than both the regional and national averages across the whole IHMA, the highest paying area being Mid Suffolk (£465.70).
6.23 The table below also demonstrates the pay gap between male and female workers at an hourly rate. Full time female workers are paid less than male full time workers across the IHMA as well as at the regional and national levels. However, Suffolk Coastal (£15.46) has a higher hourly pay than the national (£14.25) and regional (£15.00) averages for men.
|
Gross Weekly Pay |
Suffolk Coastal (pounds) |
Babergh (pounds) |
Mid Suffolk (pounds) |
Ipswich (pounds) |
East of England (pounds) |
Great Britain (pounds) |
|
Full time workers |
586.30 |
547.10 |
503.50 |
492.70 |
569.40 |
541.0 |
|
Male full-time workers |
625.70 |
630.30 |
532.20 |
544.40 |
613.30 |
581.20 |
|
Female full-time workers |
433.50 |
405.80 |
465.70 |
421.0 |
496.90 |
481.10 |
|
Hourly Pay – Excluding Overtime |
|
|
|
|
|
|
|
Full-time workers |
14.70 |
13.65 |
12.78 |
11.90 |
14.30 |
13.66 |
|
Male full-time workers |
15.46 |
14.50 |
12.90 |
13.07 |
15.00 |
14.25 |
|
Female full-time workers |
11.61 |
10.84 |
11.47 |
10.93 |
13.12 |
12.84 |
Table 40: Earnings by residence (NOMIS. 2016)[96]
6.24 In keeping with the lower level of professionally employed people working in Ipswich, gross full-time weekly pay is below the regional average and the national average. Gross weekly pay in Ipswich is £492.70, compared to an average of £569.40 in the east and a national average of £541.00.[97] Full-time female workers earn a third less than full-time male workers in Ipswich (77.3% of male full-time gross weekly earnings).
6.25
Socio-Economic Classification of Occupations
6.26 Figure 45 overleaf demonstrates the differences in occupational mix between the districts of the IHMA. it is apparent that Suffolk Coastal and Babergh are broadly similar in terms of socio-economic classification of occupations. They have the highest combined total percentage of the population in the Managers and Senior Officials and the Professional Occupations categories. Mid Suffolk shows a similar trend to that of Suffolk Coastal and Babergh with the exceptions of Professional Occupations, Associate Professionals and Technology Occupations and Sales and Customer Service Occupations. Ipswich has the highest percentages in Personal Service Occupations, Sales and Customer Service Occupations, Process Plant and Machine Operatives and Elementary Occupations but with the lowest proportion for Managers and Senior Officials and Administrative and Secretarial Occupations.
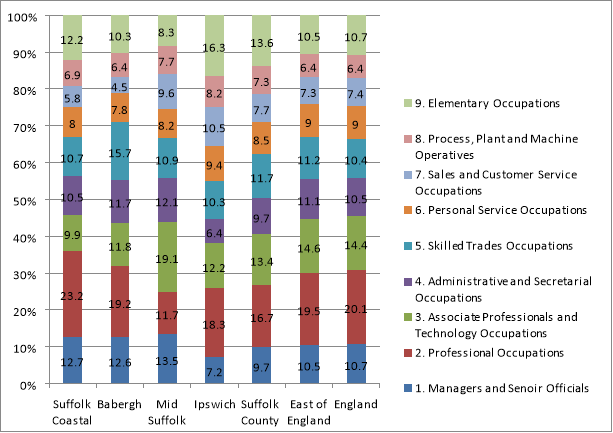
Figure 45: Socio-economic classification of occupation (Suffolk Observatory. 2016)[98]
District and Town Centres
6.27 Ipswich is the largest town centre within the Ipswich Housing Market Area and this is supplemented by a number of smaller district and local centres within the Borough. Overall there are 11 district centres and 34 local centres within the Ipswich Borough area. The district centres provide important local day-to-day shopping facilities/services for their surrounding local residential areas. This is also supplemented by the Waterfront area.
6.28 In terms of retail ranking, Ipswich town centre is classified as a 'regional centre' and its ranking has improved from 67 in 2009 to 63 in 2016, the highest ranking and classification of any retail centre in the Ipswich Housing Market Area.98
6.29 Only four Suffolk Coastal centres feature in VenueScore rankings: Felixstowe, Woodbridge, Saxmundham, and Adleburgh. Felixstowe has experienced a considerable improvement in its rankings between 2009 and 2016 with the centre sitting above Stowmarket, Woodbridge, Saxmundham and Adleburgh. As expected Felixstowe sits below the larger centres of Ipswich, Colchester and Bury St Edmunds. The centres of Adleburgh, Saxmundham and Woodbridge were not included in the 2009 rankings. These centres are currently ranked below Stowmarket and Felixstowe.
6.30 Ipswich Town Centre is the principal shopping and leisure location in the Borough. The town centre attracts shoppers and visitors from a wide catchment which extends beyond the Borough area. The centre provides a mix of retail and leisure facilities including some 66,750sq m gross of retail floorspace, 8,630sq m of retail service floorspace, 31,290sq m gross leisure service floorspace, and 14,010sq m gross financial and business services floorspace (source: Experian Goad Survey, November 2016). In addition to retail and leisure facilities, the town centre also contains a range of other uses including office, commercial, cultural, tourism and residential uses. These uses attract people to the town centre for reasons other than purely shopping and/or leisure.[99]
6.31 In terms of out-of-centre retail and leisure provision there is a significant concentration of retail/leisure parks in the Ipswich urban area. Figure 5.5 (46) below provides details of the main retail/leisure parks and sets out the current key occupiers.
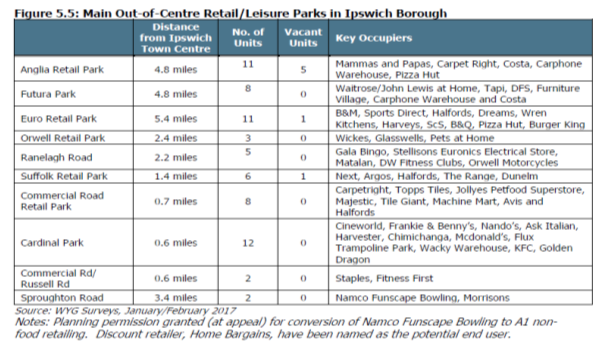 Figure 46 (5.5): Main Out-of Centre Retail/Leisure
Parks in Ipswich Borough
Figure 46 (5.5): Main Out-of Centre Retail/Leisure
Parks in Ipswich Borough
6.32 The Waterfront provides a unique destination which currently compliments retail/service/leisure facilities in the town centre. There are still a number of parcels of land/vacant buildings along the Waterfront which are to be redeveloped. It is considered important that the redevelopment of these sites/buildings provides the right balance of uses along the Waterfront and that such uses ensure that it continues to compliment and work alongside the town centre rather than compete with it. It is noted that the New Anglia Local Enterprise Partnership and Homes and Communities Agency (HCA) have recently approved a £15m loan to restart the development of the prominent "Winerack" structure/building on The Waterfront.
Culture, Leisure and Tourism
6.33 Total spend by Ipswich residents, and day visitors and domestic and overseas staying visitors in 2015 was over £15,413,827. This makes tourism a very important part of the local economy. The table below shows spend by the top venues and events.
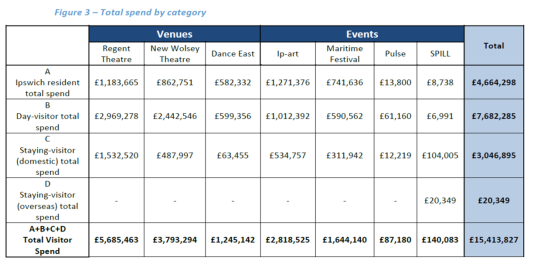
Figure 47: SPILL = spend per ticket based on each person attending a minimum of five events
6.34 The most popular venue by all spend is the Wolsey Theatre and represents 36.8% of all spend. This means that more than £1 in every £3 is spent at the Wolsey Theatre. Around £1 in £5 is spent by GB residents staying in Ipswich. The overseas market is under-developed. There was then a marginal increase in 2013 peaking at 79,000, but since then the numbers of overseas visitors has declined with 68,000 reported in 2015.[100]
6.35 Ipswich is the County town of Suffolk with a population of 140,000 and an immediate catchment of 350,000 (15 mile radius). Its history is as a port and, in recent years, its water frontage has been transformed to include hotels, the university campus, the Jerwood dance house, a range of bars and cafés and high quality residential units.
6.36 Elsewhere, Christchurch Park provides one of the largest green spaces in any UK urban centre. Other attractions include historic buildings and theatres, with Ipswich enjoying more National Portfolio Organisations (NPOs) than any other location outside of London. Beyond, the wider County boasts a splendid rural backdrop including a coastal region, Dedham Vale and the mid-Suffolk area, with links to Gainsborough and Constable.[101]
Yet, Ipswich has failed to reach its potential as a visitor and tourist destination. Research by VisitEngland in 2013 suggested that trips to urban areas had increased by 31% and 22% of overnight stays were to the countryside. Ipswich has not grown at this rate.[102]
6.37 It is estimated that the value of tourism to Suffolk is £1.85 billion a year. AECOM estimated that approximately £220 million of visitor income arrives in the Greater Ipswich economy annually, £34million of this arriving in Central Ipswich. However, they also noted that the average expenditure for an Ipswich overnight visitor was £131, significantly below the County average of £163 (around one fifth lower spend than the average Ipswich spend). The duration of stay was also lower in Ipswich than for the wider County.
6.38 A Visitor Destination Plan has been prepared by AECOM (2015). Changes in the make-up of the population will have a major effect on society and subsequently the choices that consumers make in respect of leisure activity. The increasing proportion of the population in young (0-18 years) and older age groups (55 years+), and the shrinking working age population, are key drivers in this context. One of the consequences is the changing shape of the family and roles within it. Examples include the role of grandparents in terms of childcare, greater integration between generations, growth of untraditional families with increasing numbers of single parents, step parents and gay parents.
6.39 An aging population presents a different set of needs that enterprises and amenities will be required to address, particularly in terms of accessibility. The next retired generation of baby boomers will also have a different attitude, lifestyle and propensity for leisure activity than previous generations and is also better financially equipped. This means that destinations will need to be able to present suitable experiences to match different leisure interests.
6.40 There is an increasing emphasis on having a more active and healthier lifestyle, reinforced by rising perceptions of pressures on individual's time and blurring of the lines between work and leisure. This increasingly health conscious trend is forecast to continue. This is already impacting on tourism through the availability of activity related to cultural capital and the learning of new skills or acquisition of knowledge through leisure activity. Examples here include the increase in craft tourism and areas relating to cuisine and hobbies.
6.41 Hotel occupancy trends for Ipswich are considered to be
good, with positive overall occupancy (73%) coupled with a
strengthening of occupancy between 2013 and 2014 (+1.9
percentage points). This position reflects the presence of
known hotel brands and more upmarket hotels in the town that
are able to drive their own market.
6.42 However, in comparison with East Anglia as a whole, there is still room for improvement. Overall occupancy is higher for East Anglia (75.6%) with growth between 2013 and 2014 (+5.6 pp). East Anglia witnessed similar seasonal variations in performance, although month-to-month performance in 2014 was always slightly higher than for Ipswich. The main driver of the additional performance in East Anglia appears to be the off-season months, with performance in November and December 2014 being particularly strong when compared to Ipswich.
6.43 The graph below shows the importance of different issues in attracting visitors to Ipswich. Although a large proportion were related to using Ipswich as a base for the wider attractions across Suffolk and the attractiveness of the surrounding area, the Marina, parks and open spaces, and the range of Ipswich attractions featured highly.
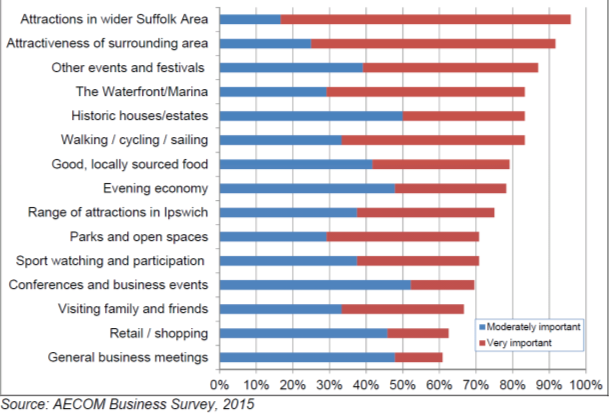
Figure 48: Various issues attracting visitors to Ipswich
6.44 Of the assets within Ipswich, the events and festivals and the waterfront/marina feature strongly. However, all the categories demonstrate some degree of importance, suggesting Ipswich has a multi-faceted offer from both a leisure and business perspective.
Visitor Expenditure
6.45 Tourists to Ipswich spent £179.7 million in 2013, approximately 22.1% of the visitor value for the county. Over two-thirds (68.5%) of the expenditure is generated by domestic day visitors. This is predominantly due to the high level of average expenditure of a day visitor to Ipswich (£37.50), which is substantially higher than the Suffolk average (£25.60) and only below Forest Heath (£39.40).
6.46 Domestic overnight visitors generated approximately £34.0 million in Ipswich. The average expenditure for this type of visitor (£131.30) is below the Suffolk average (£163.50). This partly reflects the lower duration of stay in Ipswich, although spend per night is still £4.20 lower on average for Ipswich than the county at £49.50.[103]
6.47 Approximately 6,100 people work in tourism related industries in Ipswich. This equates to 9.0% of all employment which compares to 10.1% across Suffolk. Tourism related employment rose from 2010 to 2012 and remained relatively stable in 2013.
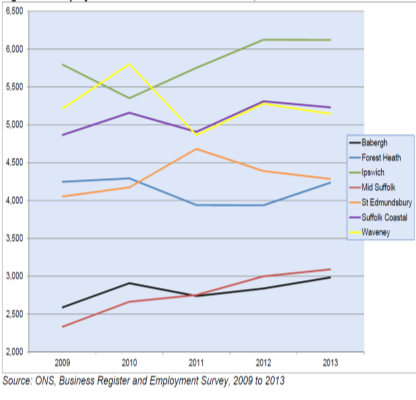
Figure 49: Employment in Tourism-related Industries
Future Considerations
- Further improving the retail ranking of Ipswich town centre as a 'regional centre' from 63 in 2016
- Maintaining the vitality and viability of the Ipswich town centre and the district centres
- Improving the rate and number of new jobs created
- Growth in the 'staycation' market and weaving Ipswich into the Suffolk tourist trail
- Impact of Brexit – weaker pound UK more attractive location for overseas visitors and business
- Impact of new fast London train service to Ipswich
Likely evolution of the baseline without the Local Plan
- The vitality and viability of the town centre could be depleted
- Without the allocation of employment land employment growth could be sporadic and unsustainable
- Investment decisions may falter or be sporadic
- Infrastructure to support existing and future business could fail
- Ipswich would not reach its potential in terms of sustainable tourism
Key data sources
- Retail and Leisure Study 2017 (WYG)
- Labour Market Profile – NOMIS – Official Labour Market Statistics
- Suffolk Observatory
- 2011 Census Home | Profiles | Area Profile - InstantAtlas™ Server
- AECOM Ipswich Visitor Destination Plan Baseline (April 2015)
- ONS Business and Employment data
Key Issues for the Sustainability Appraisal
- The need to support and maintain a sustainable local economy
- Enhancing town and service centres and their role
|
|
Key SA issue across Ipswich and Suffolk Coastal |
Ipswich Specific Issues |
|
Economy |
The need to support and maintain a sustainable local economy |
Competition for land from housing. Full-time female workers earn a third less than full-time male workers in Ipswich. Promoting growth in key employment sectors. |
|
Enhancing town and service centres and their role |
Changing nature of the high street, local and district centres and changing shopping habits. |
Table 41: Key Issues – Economy
Transport and Connectivity
6.48 People living in, working in or visiting Suffolk rely upon transport networks in their day to day lives, whether for example, to get to work, to access healthcare, leisure and other services, to transport goods, or to visit friends and family. The transport infrastructure is vital to spatial planning and must serve rural and urban areas and diverse user groups.
6.49 The planning authorities in the IHMA work with partners on transport and travel matters. These partners include Suffolk County Council (Highway Authority), Highways England which is responsible for the trunk road network and Network Rail, among others.
Travel to work
6.50 The table below displays the distances travelled to work by residents throughout the IHMA. The majority of the rural district residents travel to work between 0km and 20km: Suffolk Coastal (63%), Babergh (57.5%), Mid Suffolk (54%), Ipswich (72.9%), and East of England (59.3%). The rural districts are similar to the east of England figure and Ipswich has a higher figure which is to be expected in a more urban area.
|
Distance travelled to work |
Suffolk Coastal |
Babergh |
Mid Suffolk |
Ipswich |
East of England |
||||
|
count |
% |
count |
% |
count |
% |
count |
% |
% |
|
|
All categories |
58,882 |
100 |
42,632 |
100 |
48,942 |
100 |
65,756 |
100 |
100 |
|
Less than 2km |
9,711 |
16.5 |
6,696 |
15.7 |
6,219 |
12.7 |
16,176 |
24.6 |
16.5 |
|
2km to less than 5km |
8,326 |
14.1 |
4,722 |
11.1 |
4,085 |
8.3 |
18,455 |
28.1 |
15.4 |
|
5km to 10km |
9,055 |
15.4 |
5,342 |
12.5 |
6,951 |
14.2 |
6,870 |
10.4 |
12.7 |
|
10km to 20km |
10,046 |
17 |
7,760 |
18.2 |
9,198 |
18.8 |
6,413 |
9.8 |
14.7 |
|
20km to 30km |
3,172 |
5.4 |
3,577 |
8.4 |
4,967 |
10.1 |
2,505 |
3.8 |
8.3 |
|
30km to 40km |
1,526 |
2.6 |
1,286 |
3 |
2,170 |
4.4 |
1,472 |
2.2 |
4.5 |
|
40km to 60km |
1,093 |
1.9 |
921 |
2.2 |
1,365 |
2.8 |
1,065 |
1.6 |
4.4 |
|
60km and over |
2,756 |
4.7 |
2,557 |
6 |
2,220 |
4.5 |
2,890 |
4.4 |
3.7 |
|
Work mainly at or from home |
8,527 |
14.5 |
5,968 |
14 |
7,484 |
15.3 |
4,734 |
7.2 |
10.9 |
|
Other |
4,670 |
7.9 |
3,803 |
8.9 |
4,283 |
8.8 |
5,176 |
7.9 |
8.9 |
Table 42: Distance travelled to work [104]
6.51 Figure 50 below, displays travel to work by mode data. The figure clearly shows the importance of car and van travel throughout the district. For this mode Ipswich has a slightly lower figure, which is to be expected from an urban area. This is compensated for by walking and bus use which as can be seen from the graph are higher in Ipswich than the other districts.
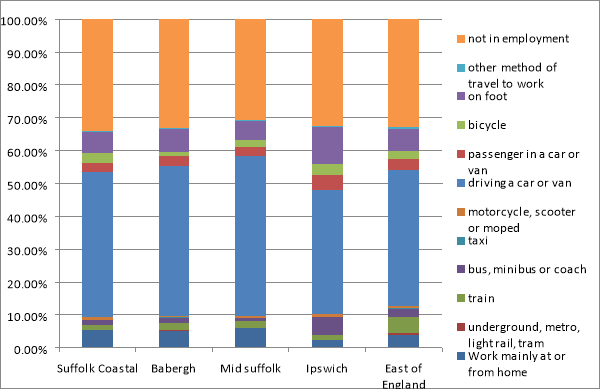
Figure 50: Transport to work by mode (Census. 2011)[105]
6.52 Ipswich is a compact town. Nowhere is further than 4 miles from the town centre. It is a town on a human scale and that means it lends itself to walking and cycling. However, car ownership, whilst lower than the average in Suffolk, has increased from 1 car per household in 2001 to 1.06 cars per household in 2011 and travel to work information indicates that cars still dominate, as illustrated in Figure 51, overleaf. It is thought that one reason behind the growth in car based commuting between 2001 and 2011 may have been that Ipswich residents were having to commute further to jobs outside the Borough.
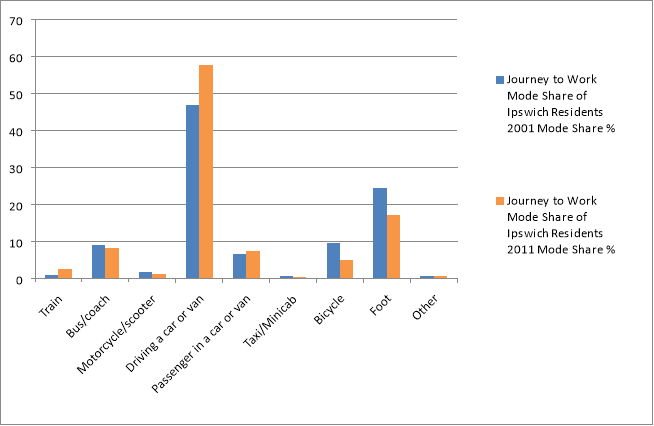
Figure 51: Ipswich journey to work by mode 2001 – 2011[106]
Key Strategic Transport Projects
6.1 At a strategic level, the congestion problems experienced in Ipswich when the Orwell Bridge closes are well documented. Furthermore, insufficient development of the strategic road network in Ipswich has resulted in increased congestion in certain parts of the town as the existing network struggles to handle the impact of an increased population within the town and the wider residential areas that surround it. This exacerbates problems with air quality and also has an economic impact. A number of projects are underway/have been completed to address this problem and these are detailed below.
Travel Ipswich
6.2 The £21 million scheme was completed in 2016 and included a package of traffic management measures such as real time passenger information and urban traffic management control as well as promotion of sustainable travel, through for example upgraded bus stations, wayfinding and moving guardrails. There is an aspiration to have a single bus station in the future.
The Upper Orwell Crossings
6.3 These proposals have been allocated £77 million in government funding. They include three crossings, two of which will be available for all road users with the third crossing of the Prince Phillip Lock for pedestrians and cyclists only. The proposals aim to reduce travel journey times between east and west of the River Orwell, reduce congestion on the Star Lane Gyratory and 'unlock' sites for regeneration in and around the Wet Dock.
Ipswich Northern Routes Study
6.4 This study aims to assess the strategic transport opportunities including road, rail, bus, cycle and other strategic interventions in order to facilitate and support the delivery of housing and employment growth in north Ipswich and the wider IHMA.
Private vehicles and car parking
6.5 Ipswich is connected to the strategic road network with a number of links offering direct access to the A14 and A12, but there are existing junction capacity and safety issues which are set to worsen within the current plan period.
6.6 The Travel to Work survey is undertaken and published each year by Suffolk County Council. The 2016 results show that of the major employers surveyed in Ipswich Borough between 39.5% (Ipswich Borough Council) and 86.5% (East of England Co-operative Society) employees travel to work by car as a single occupant. There is a noticeable difference in travel method between town centre locations and out of centre locations, with higher car usage to the latter. The 2011 Census reported that 4,674 people in the Borough work from home. Historic data for the baseline organisations in the travel To Work Survey 2016 shows that working from home has decreased since 2010.
6.7 IBC and SCC are currently producing a car parking strategy which will include an examination of commuter requirements, the needs of shoppers and business users, pricing strategy and car park location. The strategy will allow partners to deliver a parking offer that supports the town's vitality, viability and accessibility and not detract from any sustainable transport ambitions.
Walking and Cycling
6.8 2011 Census Data indicates that for Ipswich residents, 25% of journeys are fewer than 2km in length, which is within walking distance for most adults, and 28% are between 2km and 5km, which is within cycle distance.
6.9 These make up over 34,000 work journeys, and yet only approximately 14,000 journeys are made by these two modes (with a further 5,000 work journeys undertaken by bus).
6.10 Given these numbers, there is significant potential to increase the number of journeys made by foot and cycle, which would have significant positive impacts on congestion, health, air quality, noise and the environment.
6.11 Ipswich Borough Council has the objective of increasing the level of cycling in Ipswich, by ensuring new developments facilitate cycling, setting the framework for the creation of a safe, attractive cycle network, including cycle parking, supporting improved provision for cycling within existing development and reinforcing the role of the Borough Council in promoting cycling.
6.12 Cycle routes linking schools, colleges, employment and retail areas are, at present, limited and disjointed, with few off-road options and a lack of secure cycle parking at key destinations.
6.13 The Ipswich Borough Council Cycling Strategy Supplementary Planning Document identifies a number of potential enhancements for Ipswich's cycle network generally, including the following;
- Improved signage for cyclists;
- Relocation of existing street furniture that is a potential hazard;
- Traffic calming measures;
- On-road cycle lanes;
- Improved surfacing; and
- Where possible – segregated cycle routes
6.14 Figure 52 is an extract from the Ipswich cycle map. It indicates that there are areas of the town where cycle infrastructure can be improved.
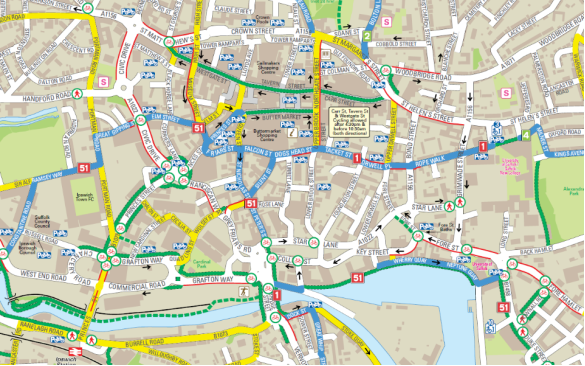
Figure 52: Extract from Ipswich Cycle Map
6.15 Barriers presented by busy roads such as the Star Lane gyratory, Civic Drive and Crown Street create a severance effect and can deter people from making trips on foot/by bicycle or result in unpleasant and dispiriting journeys. Ipswich has some wayfinding signage and improved pedestrianised areas have recently been developed, however there is more work to be undertaken on improving the public realm.
Public transport
6.16 As discussed previously, advanced traffic management and control systems have been introduced in Ipswich to help achieve greater efficiency and priority for buses. Notwithstanding this, congestion is a significant issue in the town centre and, as figure 53 demonstrates, there is a wide area of central Ipswich that relies on circulatory bus stops, and improvements must ensure that all of Ipswich remains an accessible destination by public transport.
6.17 Furthermore, it would make sense in terms of encouraging sustainable travel and integrated journeys, to have a single bus station.
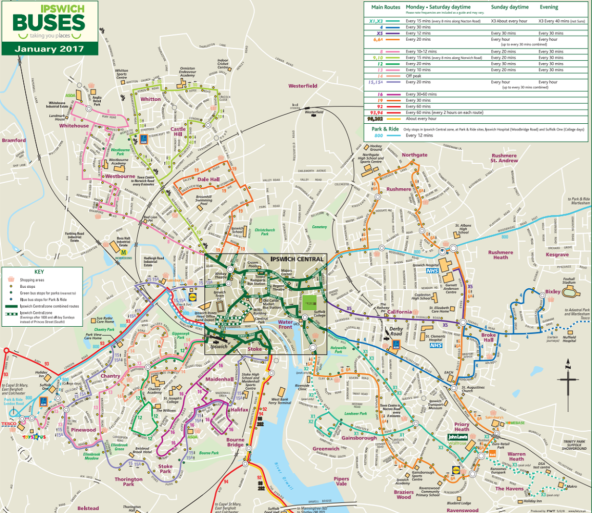
Figure 53: Congestion issues in the town centre
6.18 Park and ride was used by only 0.5% of respondents according to the 2016 travel to work survey, the lowest figure seen during the survey's lifetime. Suffolk County Council has recently announced plans to increase the use of the service among its staff.
6.19 Ipswich is well connected by rail and is situated on the Great Eastern Main Line ensuring relatively good access to the London, Essex and Norfolk. Connections to other regional hubs such as Cambridge, Peterborough, Lowestoft and Felixstowe are slow or infrequent and require improvement. Franchise improvements are expected to deliver some improvements, including faster journey times (e.g. London in 60 minutes) and improved frequencies.
6.20 There are also opportunities to improve facilities at Ipswich's other stations (Westerfield and Derby Road).
Future Considerations
- Mobility as a Service (MaaS), new models of sharing and (car) ownership
- Information for journey planning Encourage the development of digital travel planning and 'e' ticketing solutions to help customers plan, pay for and undertake trips with confidence
- Greater provision of secure cycle parking
- Autonomous vehicles
- Hydrogen vehicles and electric vehicles - greater provision of electric and/or hydrogen charging points
- Encouraging and facilitating hub and home working
- The London Mayor has published a new transport strategy for London that 80% of journeys made in the capital are by public transport, walking or cycling
Likely evolution of the baseline without the Local Plan
- SCC is Highway Authority therefore has ultimate responsibility for all highways decisions.
- An increase in population and households in the IHMA will likely generate additional transport movements, many of which may be in private vehicles. This could result in increased pressure on the road network and public transport infrastructure, and could exacerbate air quality issues.
- There may be increased uptake of clean vehicle technology
Key data sources
- County-wide transport model
- Developers' Transport Assessments
- Census
- ONS
- ITAMS
Key Issues for the Sustainability Appraisal
|
|
Key SA issue across Ipswich and Suffolk Coastal |
Ipswich Borough Specific Issues |
|
Transport and connectivity |
Reducing the need to travel |
Co-location of services. |
|
Encouraging the use of sustainable transport modes |
Improving the walking and cycling environment, lack of integrated public transport and relatively cheap car parking. Provision of adequate public transport infrastructure |
Table 43: Key Issues – Transport and connectivity
Infrastructure: Digital
Broadband
6.21 Suffolk County Council's 'Better Broadband for Suffolk'[107] initiative aims to bring super-fast fibre optic broadband to 90% of the county with 85% achieving speeds in excess of 24mb by 2019. A fast and reliable internet connection can be an alternative option to physical accessibility to key services. The vast majority of Ipswich is covered by fibre broadband, however, Suffolk Coastal, Babergh, and Mid Suffolk all have large areas that are not covered by fibre broadband and are not planned to be by 2019. Having said this the major settlements in the rural districts are covered by fibre broadband, or are to be covered by the end of 2017, as well as along the key road and rail routes through the districts.
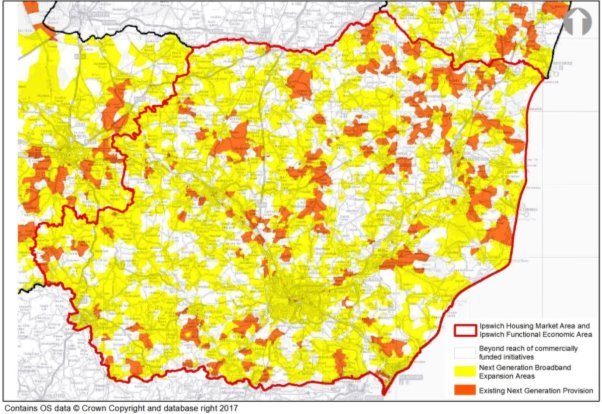
Figure 54: Broadband availability in Suffolk ( Better Broadband Suffolk).
6.22 Research suggests that increased broadband speeds
alone could add £17 billion to UK output by 2024.[108]
6.23 In October 2016, BT Openreach committed to providing all developments of thirty or more homes with free fttp (fibre to the premises) connections. For developments of fewer than 30 homes, BT will still provide free high speed broadband fibre connection to street cabinets, with the final connection to the dwelling being conventional copper cable.
Smart cities and Wi-Fi
6.24 There is evidence of the need to and benefit in consolidating and communicating public sector data to provide clearer information to businesses, residents, and visitors in the Ipswich urban area. This would allow people to interact in an intelligent iterative way to enhance and develop city-wide systems, to improve public systems and reduce costs to the taxpayers. The key benefits of a smart Ipswich are;
- helping people move around Ipswich a lot more smoothly by all means of transport;
- providing easy and consolidated system for two-way communication with citizens;
- to be inclusive and accessible to all regardless of age or ability;
- increasing spend and footfall in the town centre;
- delivering efficiency improvements in excess of its cost;
- reducing environmental impacts; and
- increasing resilience
6.25 Ipswich is currently working on a project to provide free town centre public WiFi.
Telecommunications
6.26 Between 2014-2016, mobile networks have been deploying
fourth generation (4G) networks in Suffolk and across the
UK.
6.27 Suffolk Local Authorities Draft 5 Year Infrastructure Plan 2017 - 2022 has identified the following planned investments within Suffolk as it relates to telecommunications. There are no planned upgrades to infrastructure related to the mobile networks currently identified. These will be delivered on a commercial basis by the providers.
6.28 Future 5G mobile networks for example are predicted to greatly facilitate machine to machine (M2M) capabilities, including in manufacturing, supply chain and logistics. 5G will also necessitate a blurring of fixed and mobile technologies, with greater interdependency between the two.
Assuming a similar pattern of mobile network rollout to that of 3G and 4G, it is likely that 5G rollout will similarly prioritise urban centres and major road and rail transport corridors, especially as 5G is regarded by the National Infrastructure Investment Commission as essential for the development and use of autonomous vehicles and vehicle technology in the UK.
Digital industries
6.29 The IHMA, particularly in an around Martlesham and Ipswich, has very stong digital industries including BT, Cisco, Huawei, Ericsson, TechEast, Innovation Martlesham and Ipswich Waterfront Innovation Centre (IWIC). Ipswich has strengths in a number of sectors, including digital creative industries, digital advertising and marketing, telecommunications and networking, fintech and photonics, e-commerce and app and software development.
6.30 According to Tech Nation 2017, "Tech firms value face-to-face interaction, creative thinking, large social networks, and inter firm communication. This preference for agglomeration results in firms concentrating in dense, multi-use areas in central urban locations, where exchanges of ideas between individuals and firms are facilitated by proximity to other firms.
6.31 Community engagement has helped drive the growth of Ipswich's digital industry. The IP Network and SyncIpswich hold regular Meetups, while the Eastern Enterprise Hub provides resources for aspiring entrepreneurs. Innovation Martlesham also houses digital tech businesses including Nokia, CIP Technologies and Zog Energy.
Future Considerations
- Increasing social media, mobile apps and providing services through digital platforms
- Big data – opportunities for planners and local government in general
- Supercomputing
- Advanced modelling
- 5G mobile networks
- Autonomous vehicles and robotics
- Machine learning
- Virtual reality (for use in construction etc in terms of 4D visualisation) - based on computer game technology and amalgamates programme information such as architectural and structural plans and 3D models to provide viewers with an understanding of complex plans.
- Artificial intelligence
- Satellite technology
- London to Ipswich in 1 hour and the relative proximity to the silicon roundabout in Old Street/Shoreditch
Likely Evolution of the Baseline without the Local Plan
- Missed opportunities to capitalise on the digital economy in the IHMA
- Damage to the rural economy from lack of high speed broadband connectivity
- Poor mobile phone coverage could disadvantage the IHMA
Key data sources
- Tech Nation Reports
- http://www.betterbroadbandsuffolk.com/
- Association for United Kingdom Interactive Entertainment (Ukie)
Key Issues for the Sustainability Appraisal
|
|
Key SA issue across Ipswich and Suffolk Coastal |
Ipswich Borough Specific Issues |
|
Digital Infrastructure |
The need to realise opportunities for social inclusion through the provision of improved online services |
Access to fast broadband and wifi across the town. Unreliable mobile phone coverage in some areas. |
|
The need to support the growth of the digital economy |
Access to fast broadband and WiFi across the town. |
Table 44: Key Issues – Digital
Infrastructure
[99] WYG Retail and Leisure Study 2017 – not yet available online.
[100] WYG 2017 Retail & Leisure Study, paragraph 10.6.5 - not yet available online.
[101] Greater Ipswich Direct Marketing Organisation Business Plan 2016
[102] Op Cit
[103] AECOM Ipswich Visitor Destination Plan Baseline (April 2015)